

Family violence and football: the effect of unexpected emotional cues on violent behavior
- PMID: 21853617
- PMCID: PMC3712874
- DOI: 10.1093/qje/qjr001
Family violence and football: the effect of unexpected emotional cues on violent behavior
Abstract
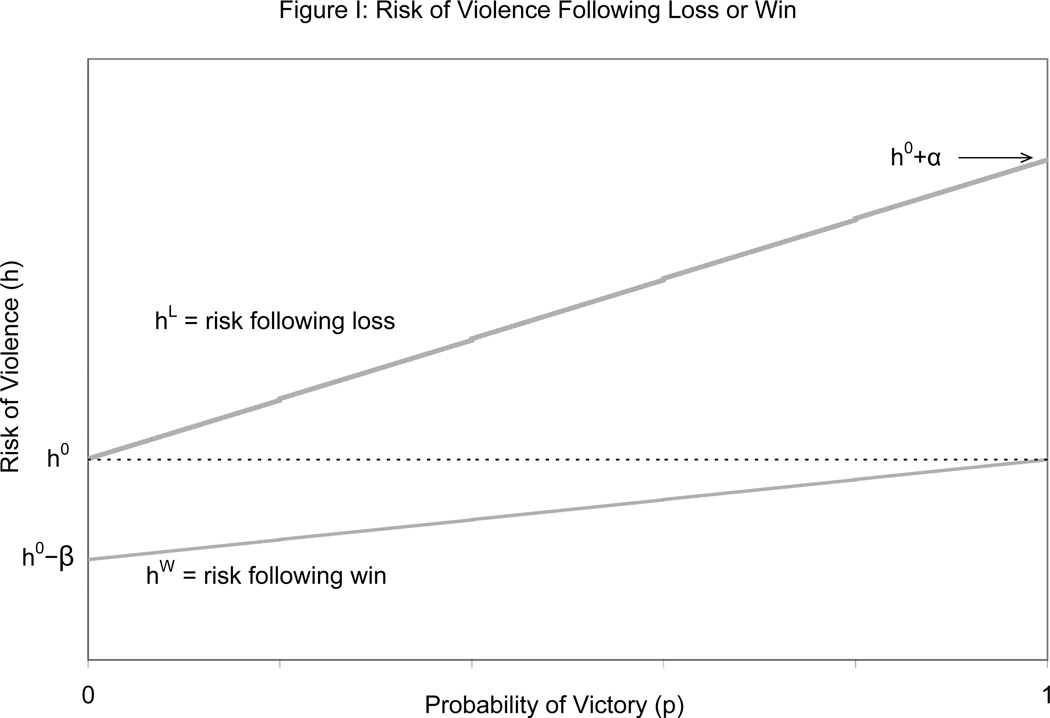
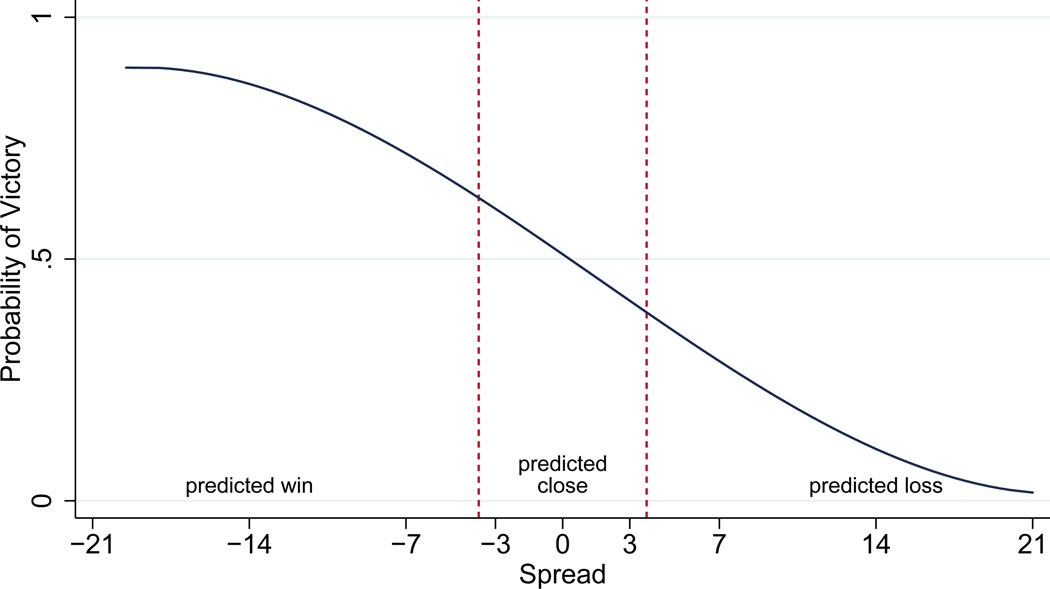
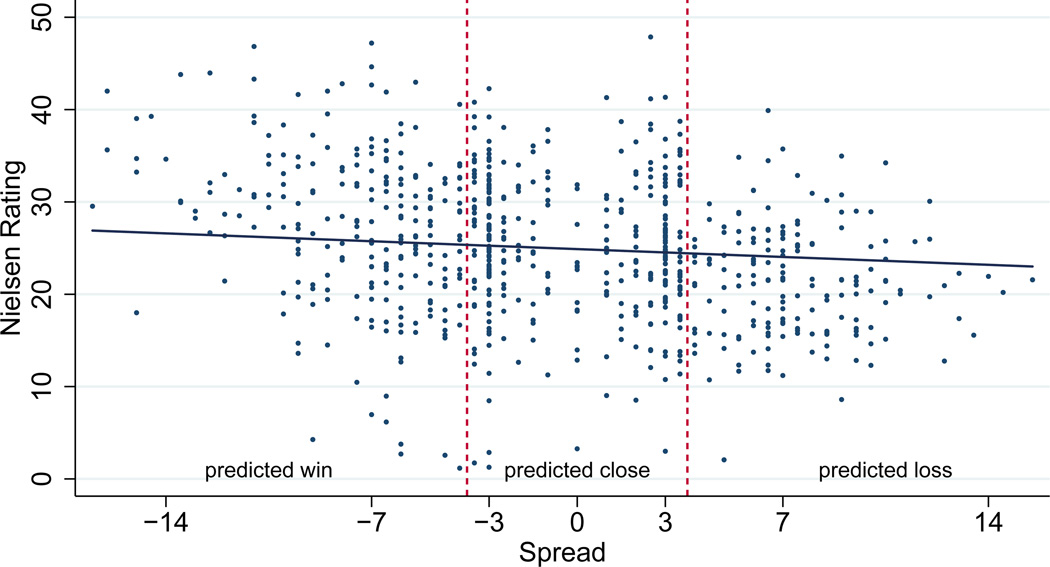
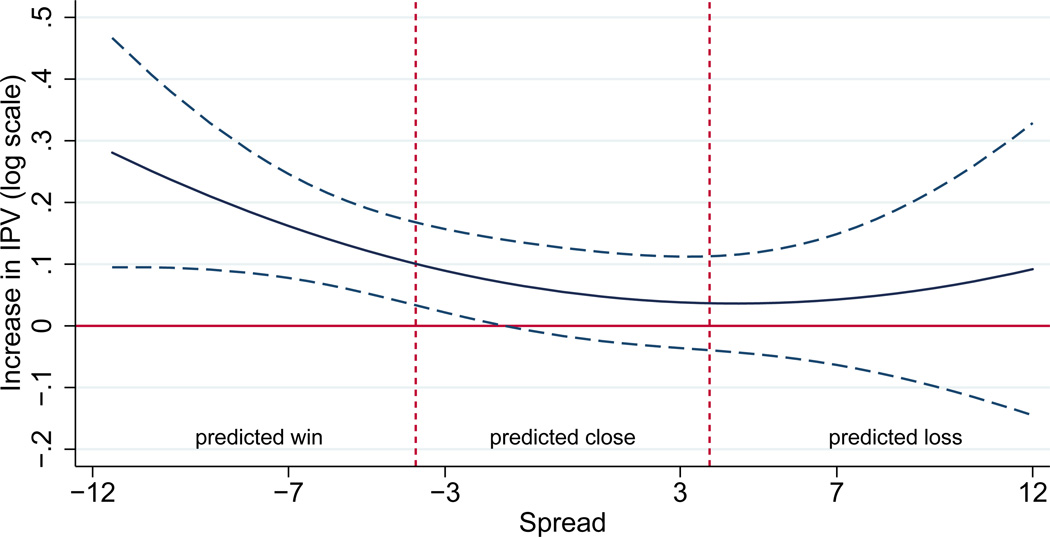
We study the link between family violence and the emotional cues associated with wins and losses by professional football teams. We hypothesize that the risk of violence is affected by the “gain-loss” utility of game outcomes around a rationally expected reference point. Our empirical analysis uses police reports of violent incidents on Sundays during the professional football season. Controlling for the pregame point spread and the size of the local viewing audience, we find that upset losses (defeats when the home team was predicted to win by four or more points) lead to a 10% increase in the rate of at-home violence by men against their wives and girlfriends. In contrast, losses when the game was expected to be close have small and insignificant effects. Upset wins (victories when the home team was predicted to lose) also have little impact on violence, consistent with asymmetry in the gain-loss utility function. The rise in violence after an upset loss is concentrated in a narrow time window near the end of the game and is larger for more important games. We find no evidence for reference point updating based on the halftime score.
Figures

References
-
- Abeler Johannes, Falk Armin, Gotte Lorenz, Huffman David. Reference Points and Effort Provision. IZA Discussion Paper No. 3939. 2009
-
- Ariely Dan, Loewenstein George. In the Heat of the Moment: The Effect of Sexual Arousal on Sexual Decision Making. Journal of Behavioral Decision Making. 2005;18(1):1–12.
-
- Baumeister Roy F, Heatherton Todd F. Self Regulation Failure: An Overview. Psychological Inquiry. 1996;7(1):1–15.
-
- Bernheim B Douglas, Rangel Antonio. Addiction and Cue-Triggered Decision Responses. American Economic Review. 2004 Dec;94:1558–1590. - PubMed
Publication types
MeSH terms
Grants and funding
LinkOut - more resources
Full Text Sources
Medical
Miscellaneous