

Approaches to normalization of spinal cord volume: application to multiple sclerosis
- PMID: 21854479
- PMCID: PMC3290735
- DOI: 10.1111/j.1552-6569.2011.00629.x
Approaches to normalization of spinal cord volume: application to multiple sclerosis
Abstract
Background and purpose: To determine the proper method for the normalization of spinal cord volume.
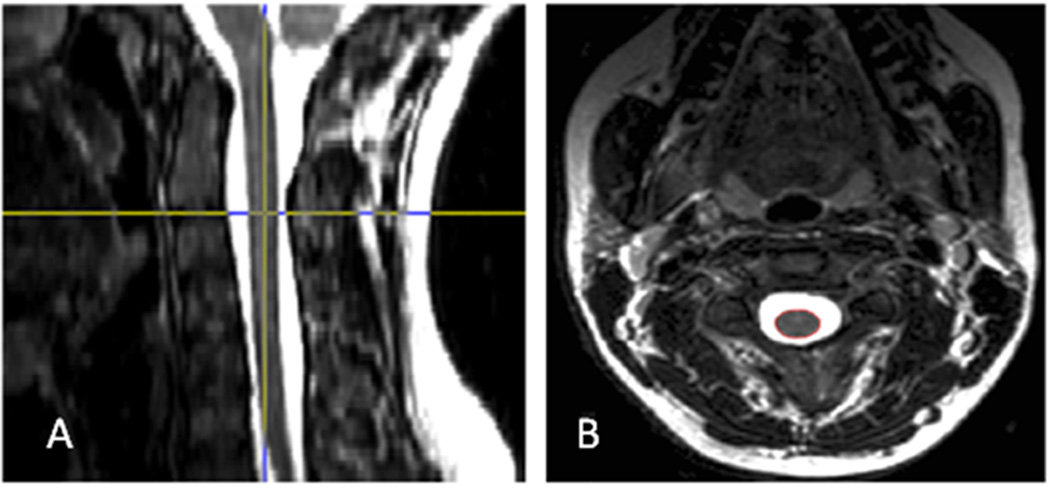
Materials and methods: A group of 34 multiple sclerosis (MS) patients (28 relapsing and 6 progressive) and 15 healthy controls had whole spinal cord 3-mm thick T2-weighted axial fast spin-echo magnetic resonance imaging (MRI) images obtained at 3T. For each participant, four volumes were measured (C2-3 volume, cervical cord volume, thoracic cord volume, and whole cord volume). The volumes were normalized by the number of slices and three potential measures of body size (intracranial volume [ICV], body mass index, and body surface area) using the proportional method.
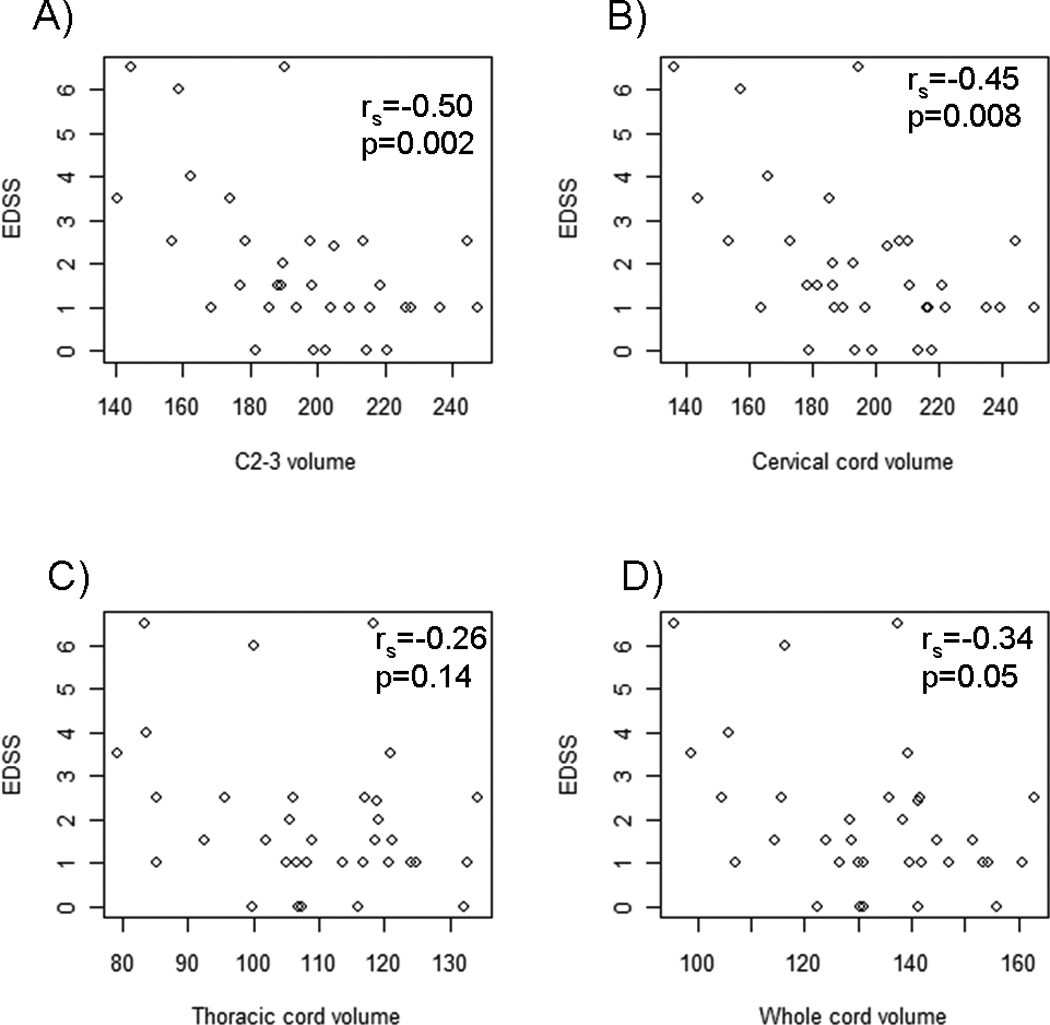
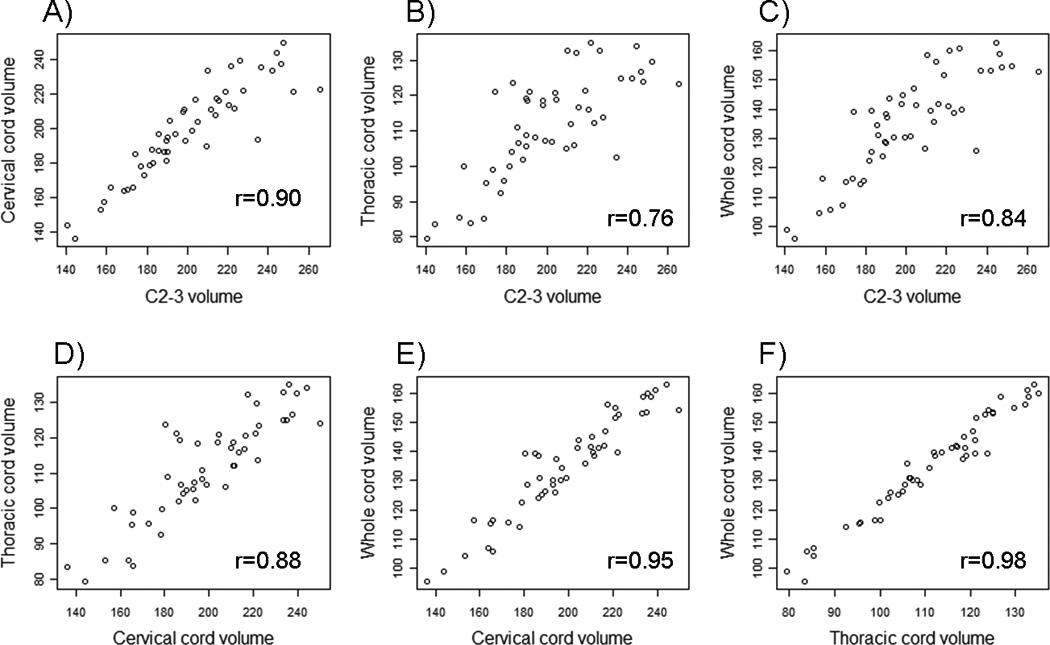
Results: All raw volumes and volumes normalized by number of slices or ICV were significantly lower in progressive MS patients compared to relapsing MS patients/healthy controls (P < .05). In addition, C2-3 volume and cervical cord volume were significantly correlated with Expanded Disability Status Scale score (P < .05). All regional volumes showed high intercorrelation, and normalization by the number of slices significantly increased some correlations. Regarding reliability, whole cord volume regardless of normalization technique had lower coefficient of variation than C2-3 volume.
Conclusions: Since normalization factor had limited impact on reliability and the ability to detect differences, normalization by the number of slices is recommended.
© 2011 by the American Society of Neuroimaging.
Figures
References
-
- Lin X, Tench CR, Evangelou N, Jaspan T, Constantinescu CS. Measurement of spinal cord atrophy in multiple sclerosis. J Neuroimaging. 2004;14(3 Suppl):20S–26S. - PubMed
-
- Lin X, Tench CR, Turner B, Blumhardt LD, Constantinescu CS. Spinal cord atrophy and disability in multiple sclerosis over four years: application of a reproducible automated technique in monitoring disease progression in a cohort of the interferon beta-1a (Rebif) treatment trial. J Neurol Neurosurg Psychiatry. 2003;74(8):1090–1094. - PMC - PubMed
-
- Gilmore CP, DeLuca GC, Bo L, Owens T, Lowe J, Esiri MM, et al. Spinal cord atrophy in multiple sclerosis caused by white matter volume loss. Arch Neurol. 2005;62(12):1859–1862. - PubMed
Publication types
MeSH terms
Grants and funding
LinkOut - more resources
Full Text Sources
Medical
Miscellaneous
