

doi: 10.1186/gb-2011-12-8-r80.
Single-cell copy number variation detection
Affiliations
- PMID: 21854607
- PMCID: PMC3245619
- DOI: 10.1186/gb-2011-12-8-r80
Item in Clipboard
Single-cell copy number variation detection
Genome Biol.
.
Abstract
Detection of chromosomal aberrations from a single cell by array comparative genomic hybridization (single-cell array CGH), instead of from a population of cells, is an emerging technique. However, such detection is challenging because of the genome artifacts and the DNA amplification process inherent to the single cell approach. Current normalization algorithms result in inaccurate aberration detection for single-cell data. We propose a normalization method based on channel, genome composition and recurrent genome artifact corrections. We demonstrate that the proposed channel clone normalization significantly improves the copy number variation detection in both simulated and real single-cell array CGH data.
Figures
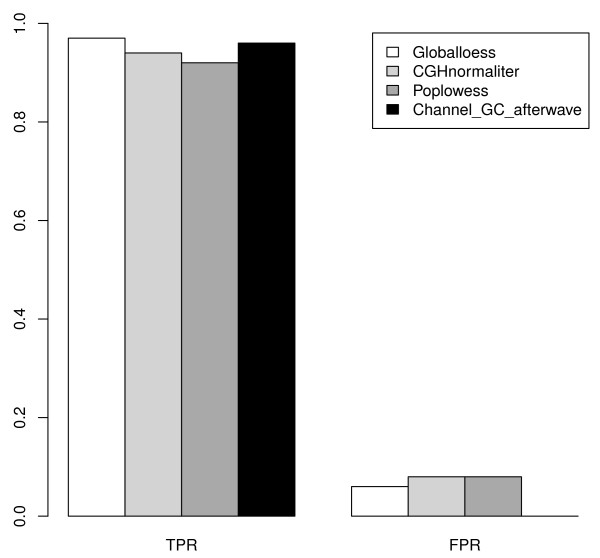
Barplot of true positive rate and false positive rate of 15 simulated samples. All the true positive rates (TPRs) and false positive rates (FPRs) were calculated after the global loess, CGHnormaliter, poplowess or channel clone normalization methods.
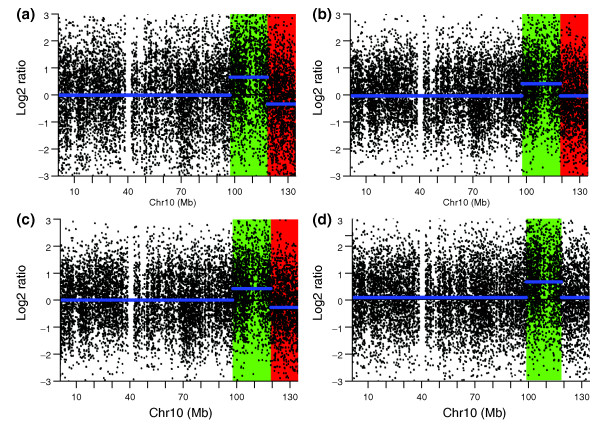
Copy number variation detection in chromosome 10 of a simulated sample. (a-d) CBS segmentation of chromosome 10 from the simulated sample 4 using global loess normalization (a), CGHnormaliter (b), poplowess (c), and channel clone normalization (d). The blue line represents the CBS segmentation line. The red region and green regions represent the deletion and duplication regions called by CGHcall.
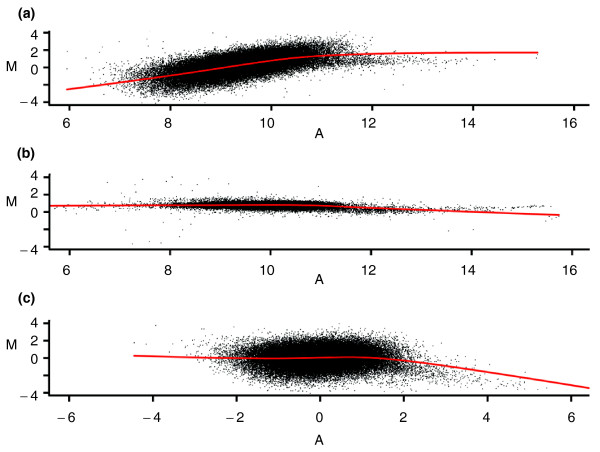
MA plot of a single EBV-transformed cell. (a-c) MA plot for EBV-transformed single lymphoblastoid cell 1162 before normalization (a), genomic DNA before normalization (b), EBV-transformed single lymphoblastoid 1162 after channel standardization (c). The red line represents a lowess curve fitted to the data. Note that after normalizations, most of the log2 ratio values are distributed randomly around zero.
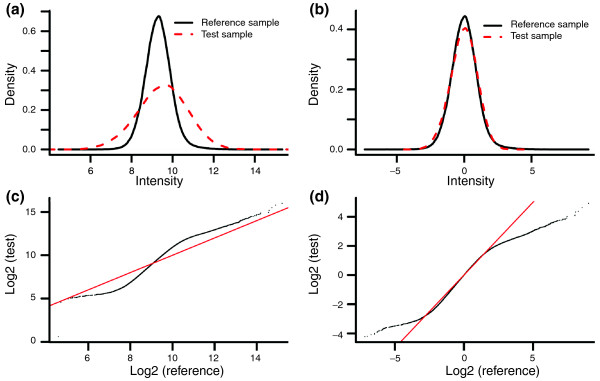
Density plot of a single EBV-transformed cell. (a,b) Density plot for EBV-transformed single lymphoblastoid cell 1162 before normalization (a), and after channel standardization (b). The solid line represents the reference sample and the dashed line represents the test sample. Note that the SD of the intensities of the test sample (SD = 1.02) is larger than that of the reference sample (SD = 0.61). (c,d) QQ plot of the intensities between the test and the reference samples before normalization (c), and after channel standardization (d).
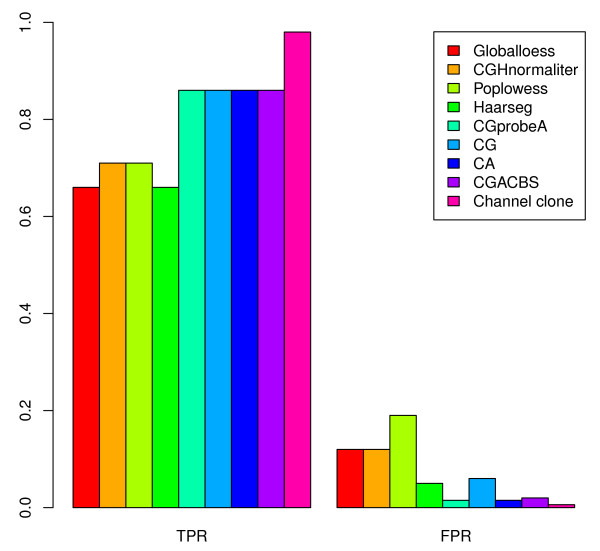
Barplot of true positive rate and false positive rate of 7 EBV-transformed cells. All the TPRs and FPRs were calculated after global loess, CGHnormaliter, poplowess, Haarseg, CG, CA, CGprobeA, CGACBS and channel clone normalization approaches.
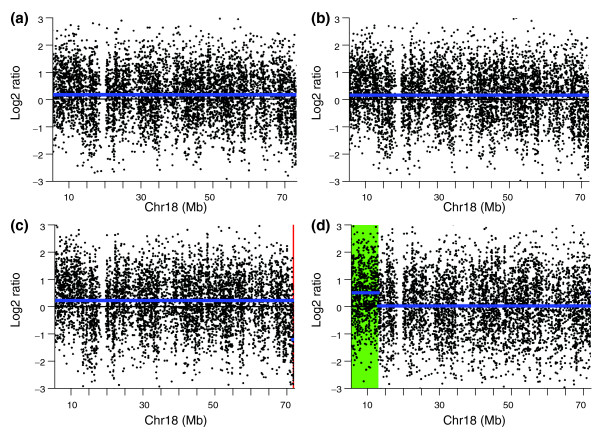
Copy number variation detection in chromosome 18 of an EBV-transformed sample. (a-d) CBS segmentation of chromosome 18 from the EBV-transformed single lymphoblastoid cell 1151 using global loess normalization (a), CGHnormaliter (b), poplowess (c), and channel clone normalization (d). The y-axis represents the log2 ratios and the x-axis represents the coordinates along the chromosome. The blue line represents the CBS segmentation line. The green region represents the duplication region called by the CGHcall program.
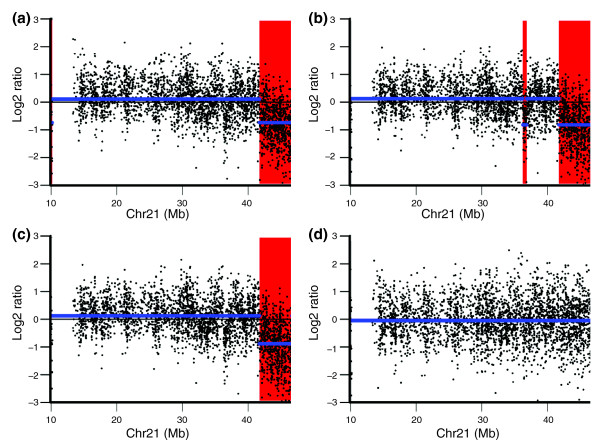
Copy number variation detection in chromosome 21 of an EBV-transformed sample. (a-d) CBS segmentation of chromosome 21 from the EBV-transformed single lymphoblastoid cell 1160 using global loess normalization (a), CGHnormaliter (b), poplowess (c), and channel clone normalization (d). The blue line represents the CBS segmentation line. The red region represents the deletion region called by CGHcall.
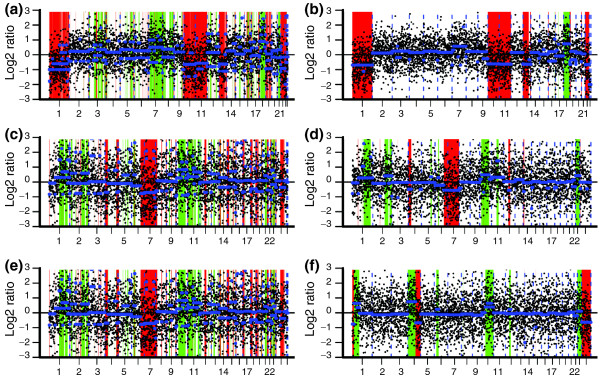
Copy number variation detection in three blastomere samples. (a,c,e) Genome-wide CNV detection of blastomere A (a), blastomere E (c) and blastomere G (e) from embryo 20 before channel clone normalization. (b,d,f) Genome-wide CNV detection of blastomere A (b), blastomere E (d) and blastomere G (f) from embryo 20 after channel clone normalization. The x-axis represents the coordinate range from chromosome 1 to × and the y-axis represents the log2 ratios. The blue line represents the CBS segmentation line. The green regions represent the duplication region and red regions represent the deletion region called by the CGHcall program.
References
-
- Vanneste E, Voet T, Le Caignec C, Ampe M, Konings P, Melotte C, Debrock S, Amyere M, Vikkula M, Schuit F, Fryns J-P, Verbeke G, D'Hooghe T, Moreau Y, Vermeesch JR. Chromosome instability is common in human cleavage-stage embryos. Nature medicine. 2009;15:577–583. doi: 10.1038/nm.1924. - DOI - PubMed
-
- Handyside AH, Harton GL, Mariani B, Thornhill AR, Affara N, Shaw M-A, Griffin DK. Karyomapping: a universal method for genome wide analysis of genetic disease based on mapping crossovers between parental haplotypes. Journal of medical genetics. 2010;47:651–658. doi: 10.1136/jmg.2009.069971. - DOI - PubMed
Publication types
MeSH terms
Associated data
- Actions
- Actions
LinkOut - more resources
Full Text Sources
Other Literature Sources
Molecular Biology Databases
