. 2011 Oct;179(4):1851-60.
doi: 10.1016/j.ajpath.2011.06.045. Epub 2011 Aug 18.

Aquaporin-1 promotes angiogenesis, fibrosis, and portal hypertension through mechanisms dependent on osmotically sensitive microRNAs

Affiliations

Aquaporin-1 promotes angiogenesis, fibrosis, and portal hypertension through mechanisms dependent on osmotically sensitive microRNAs

Robert C Huebert et al. Am J Pathol. 2011 Oct.

Abstract

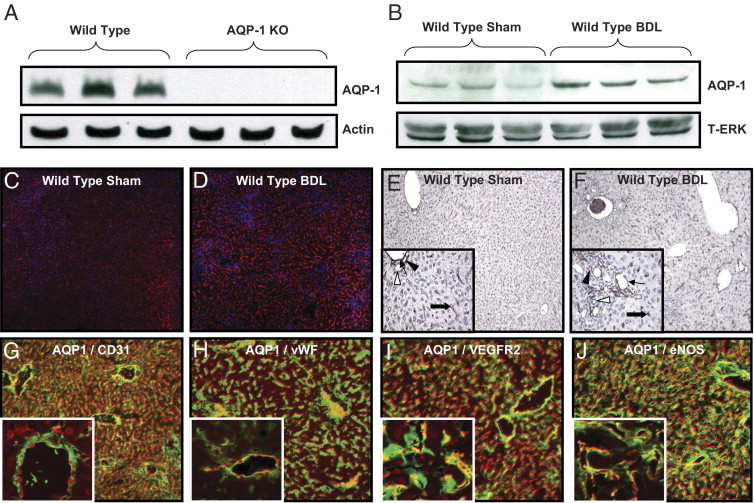
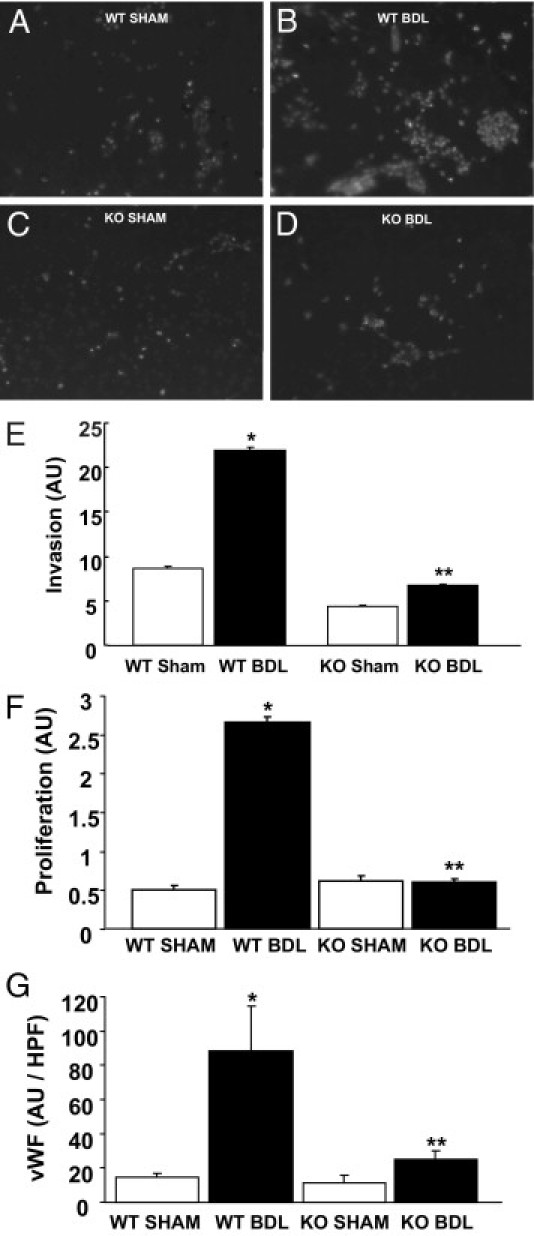
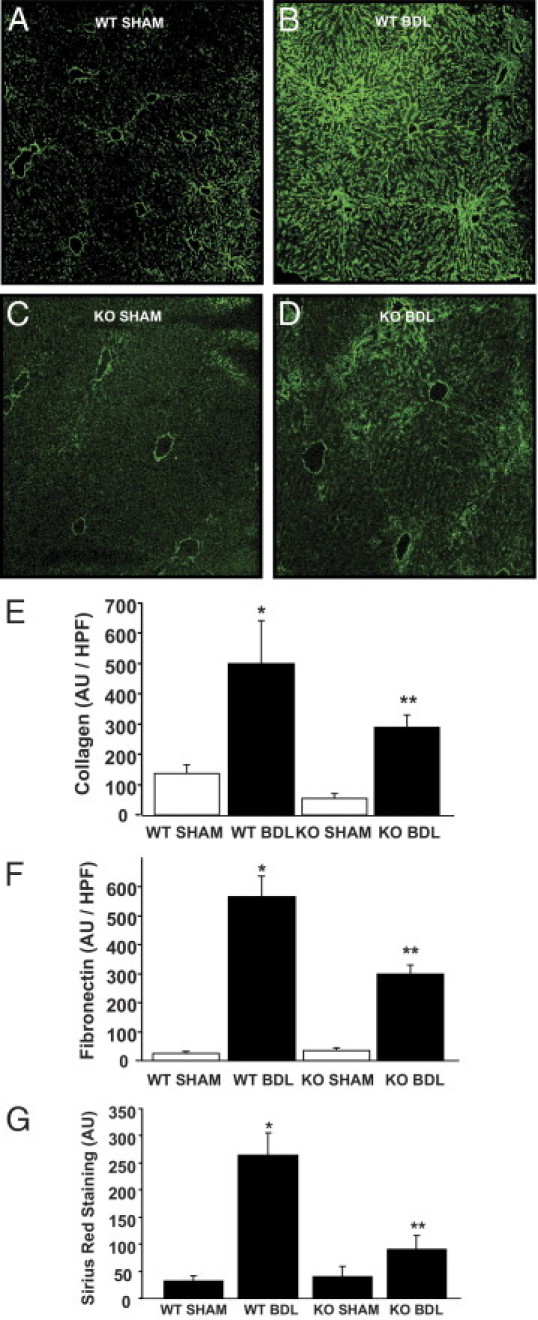
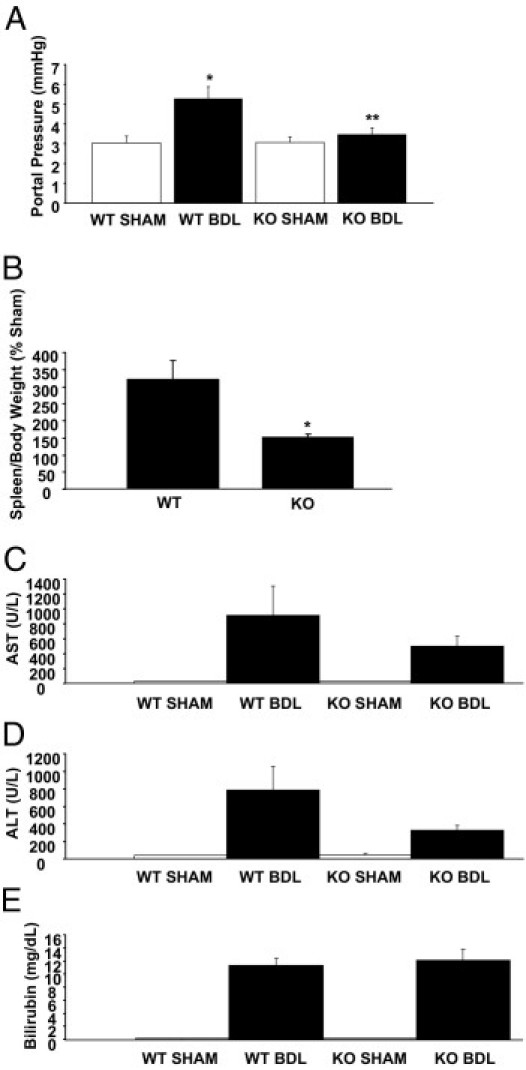
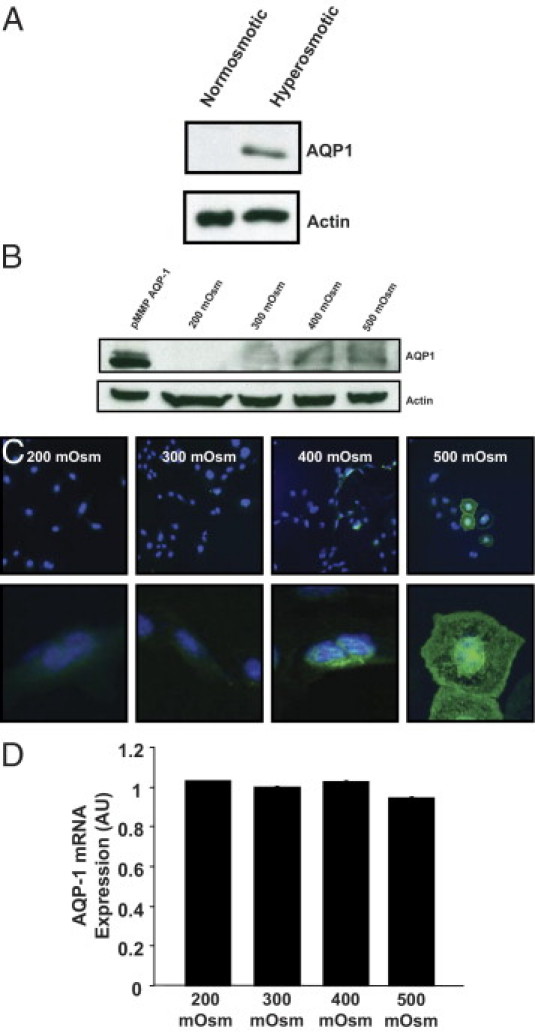
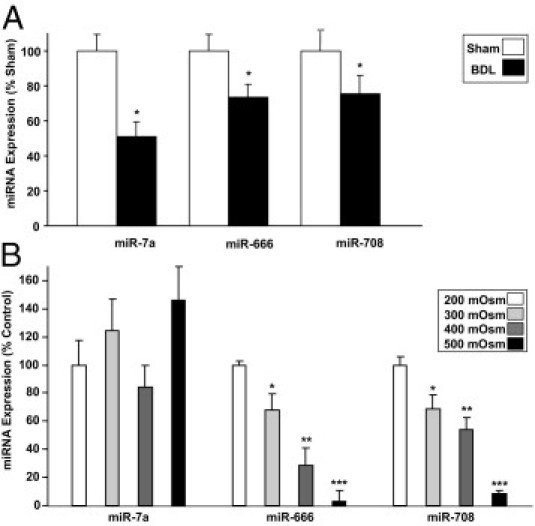
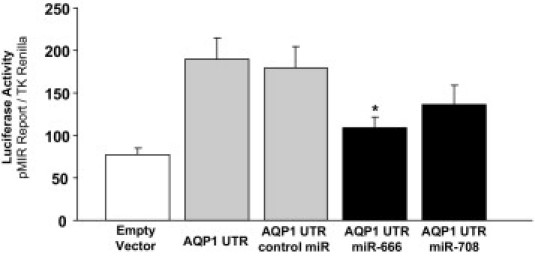
Changes in hepatic vasculature accompany fibrogenesis, and targeting angiogenic molecules often attenuates fibrosis in animals. Aquaporin-1 (AQP1) is a water channel, overexpressed in cirrhosis, that promotes angiogenesis by enhancing endothelial invasion. The effect of AQP1 on fibrogenesis in vivo and the mechanisms driving AQP1 expression during cirrhosis remain unclear. The purpose of this study was to test the effect of AQP1 deletion in cirrhosis and explore mechanisms regulating AQP1. After bile duct ligation, wild-type mice overexpress AQP1 that colocalizes with vascular markers and sites of robust angiogenesis. AQP1 knockout mice demonstrated reduced angiogenesis compared with wild-type mice, as evidenced by immunostaining and endothelial invasion/proliferation in vitro. Fibrosis and portal hypertension were attenuated based on immunostaining, portal pressure, and spleen/body weight ratio. AQP1 protein, but not mRNA, was induced by hyperosmolality in vitro, suggesting post-transcriptional regulation. Endothelial cells from normal or cirrhotic mice were screened for microRNA (miR) expression using an array and a quantitative PCR. miR-666 and miR-708 targeted AQP1 mRNA and were decreased in cirrhosis and in cells exposed to hyperosmolality, suggesting that these miRs mediate osmolar changes via AQP1. Binding of the miRs to the untranslated region of AQP1 was assessed using luciferase assays. In conclusion, AQP1 promotes angiogenesis, fibrosis, and portal hypertension after bile duct ligation and is regulated by osmotically sensitive miRs.


Figures

Figure 1
Figure 1
AQP1 is increased in liver endothelia after BDL. A: Representative immunoblots for AQP1 or actin (100 μg/lane) in wild-type or AQP1 knockout (KO) mouse liver tissue. B: Representative immunoblots for AQP1 or total extracellular signal–regulated kinase (T-ERK; 50 μg/lane) in wild-type sham operated on or bile duct–ligated mouse liver tissue. C and D: Representative images of sham operated on or bile duct–ligated mouse liver tissue stained with IF for AQP1 (red) and nuclear TOTO-3 (blue). Original magnification, ×7.5. E and F: Representative images of sham operated on or bile duct–ligated mouse liver tissue stained with IHC for AQP1 (brown) and counterstained with hematoxylin. Original magnification, ×4. Insets: High-power images. Original magnification, ×10. Arrows, portal vein; thick arrows, hepatic artery; black arrowheads, sinusoids; and white arrowheads, bile ducts. GJ: Representative images of bile duct–ligated mouse liver tissue costained with IF for AQP1 (red) and CD31, vWF, VEGFR2, and eNOS (green). Original magnification, ×10. Insets: High-power images. Original magnification, ×63. Individual color images are in Supplemental Figure S1 at http://ajp.amjpathol.org.
Figure 2
Figure 2
AQP1 knockout (KO) mice have reduced angiogenesis in response to BDL. AD: Representative images of invaded cells isolated from wild-type (WT) and AQP1 KO mice, with and without BDL stained with IF for nuclear TOTO-3 (white). Original magnification, ×10. E: Quantification of the average total fluorescence signal per high-power field is shown (n = 10 wells per cell type, and n = 3 animals per group). Data are given as the mean ± SE. F: MTS proliferation assays were performed in endothelial cells isolated from WT and AQP1 KO mice, with and without BDL. Quantification of the average spectrophotometric signal per well is shown (n = 9 wells per animal, and n = 3 animals per group). Data are given as the mean ± SE. G: Tissue from WT and AQP1 KO mice, with and without BDL, was stained with IF for vWF. Quantification of the average total fluorescence signal per high-power field is shown (n = 10 fields per animal, and n = 3 animals per group). Data are given as the mean ± SE. *P < 0.05 versus WT sham; **P < 0.05 versus WT BDL. AU, arbitrary unit.
Figure 3
Figure 3
AQP1 knockout (KO) mice have reduced fibrosis in response to BDL. AD: Representative images of wild-type (WT) and AQP1 knockout (KO) mice, with and without BDL, stained with IF for collagen (green). Original magnification, ×7.5. E: Quantification of the average total fluorescence signal per high-power field (HPF) is shown (n = 10 fields per animal, and n = 3 animals per group). Data are given as the mean ± SE. F: Tissue from AQP1 KO mice, with and without BDL, was stained with IF for fibronectin. Quantification of the average total fluorescence signal per HPF is shown (n = 10 fields per animal, and n = 3 animals per group). Data are given as the mean ± SE. G: Tissue from AQP1 KO mice, with and without BDL, was stained with Sirius red. Quantification of the average total signal per HPF is shown (n = 10 fields per animal, and n = 3 animals per group). Data are given as the mean ± SE. *P < 0.05 versus WT sham; **P < 0.05 versus WT BDL. See images in Supplemental Figure S4D at http://ajp.amjpathol.org. AU, arbitrary unit.
Figure 4
Figure 4
AQP1 knockout (KO) mice have reduced portal hypertension after BDL. A: Portal pressure was directly measured by portal vein cannulation in wild-type (WT) and AQP1 KO mice, with and without BDL. Quantification of the average portal pressure is shown (n = 6). Data are given as the mean ± SE. B: Spleen and body weight were measured in WT and AQP1 KO mice, with and without BDL. The average calculated spleen/body weight ratio of BDL animals normalized to the corresponding sham groups is shown (n = 6). Data are given as the mean ± SE. Serum was analyzed in a clinically verified reference laboratory to measure aspartate aminotransferase (AST) (C), alanine aminotransferase (ALT) (D), and total bilirubin (E) levels in WT and AQP1 KO mice, with and without BDL (n = 6). Data are given as the mean ± SE. *P < 0.05 versus WT; **P < 0.05 versus WT BDL.
Figure 5
Figure 5
AQP1 protein is induced by hypertonicity. A: Representative immunoblots for AQP1 or actin (50 μg/lane) on lysates from TSECs exposed for 72 hours to normal osmolality (300 mosm) or hyperosmolality (600 mosm). B: Representative immunoblots for AQP1 or actin (100 μg/lane) on lysates from TSECs exposed for 72 hours to varying external osmolality (200 to 500 mosm). The far left lane is a positive control using the pMMP vector for retroviral overexpression of AQP1 in TSECs. C: Representative images of TSECs exposed for 72 hours to varying external osmolality (200 to 500 mosm) and stained using IF for AQP1 (green) and nuclear TOTO-3 (blue). Original magnification: ×20 (top); ×63 (bottom). D: Quantitative real-time RT-PCR was performed on RNA isolated from TSECs exposed for 72 hours to varying external osmolality (200 to 500 mosm). The average signal normalized to a housekeeping gene and relative to the control group is shown (n = 6). Data are given as the mean ± SE.
Figure 6
Figure 6
Osmotically sensitive miRs are down-regulated after BDL. A: Quantitative real-time RT-PCR was performed on total RNA (including miR) isolated from endothelial cells derived from wild-type sham or BDL mice. The signal normalized to a housekeeping RNA and relative to the control group is shown (n = 9). Data are given as the mean ± SE. B: Quantitative real-time RT-PCR was performed on total RNA (including miR) isolated from TSECs exposed for 72 hours to varying external osmolality (200 to 500 mosm). The average signal normalized to a housekeeping RNA and relative to the control group is shown (n = 9). Data are given as the mean ± SE. *P < 0.05 versus 200 mOsm. **P < 0.05 versus 300 mOsm. ***P < 0.05 versus 400 mOsm.
Figure 7
Figure 7
miR-666 and miR-708 functionally bind the UTR of AQP1. A reporter construct containing the potential binding sites for miR-666 and miR-708 in the UTR of AQP1 was generated. Chinese hamster ovary cells were transiently cotransfected for 24 hours with the reporter construct and mimics of miR-666 and/or miR-708. Luciferase activities were measured and normalized to the control TK Renilla luciferase level. Bars represent the mean ± SE from three independent experiments. *P < 0.05 versus cells transfected with the reporter construct only.

References

    1. Schuppan D., Afdhal N.H. Liver cirrhosis. Lancet. 2008;371:838–851. - PMC - PubMed
    1. Paternostro C., David E., Novo E., Parola M. Hypoxia, angiogenesis and liver fibrogenesis in the progression of chronic liver diseases. World J Gastroenterol. 2010;16:281–288. - PMC - PubMed
    1. Iwakiri Y., Grisham M., Shah V. Vascular biology and pathobiology of the liver: report of a single-topic symposium. Hepatology. 2008;47:1754–1763. - PMC - PubMed
    1. Huebert R.C., Shah V. Hepatic Sinusoidal Endothelial Cells. In: Dufour J.F., Clavien P.A., editors. Springer-Verlag; Berlin, Heidelberg: 2009. pp. 79–91.
    1. Huebert R.C., Splinter P.L., Garcia F., Marinelli R.A., LaRusso N.F. Expression and localization of aquaporin water channels in rat hepatocytes: evidence for a role in canalicular bile secretion. J Biol Chem. 2002;277:22710–22717. - PubMed

Publication types

MeSH terms