. 2011 Oct 15;358(2):345-55.
doi: 10.1016/j.ydbio.2011.08.002. Epub 2011 Aug 10.

Specific roles for the GATA transcription factors end-1 and end-3 during C. elegans E-lineage development

Affiliations

Specific roles for the GATA transcription factors end-1 and end-3 during C. elegans E-lineage development

Max E Boeck et al. Dev Biol. .

Abstract

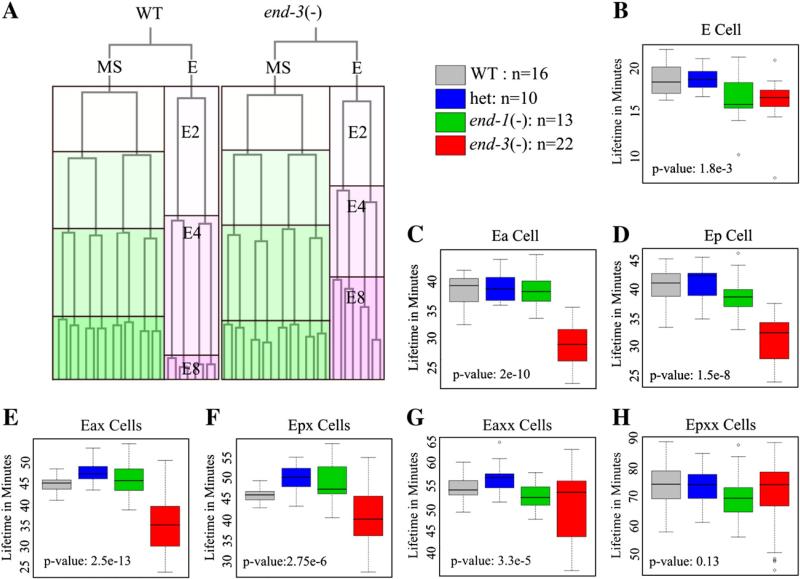
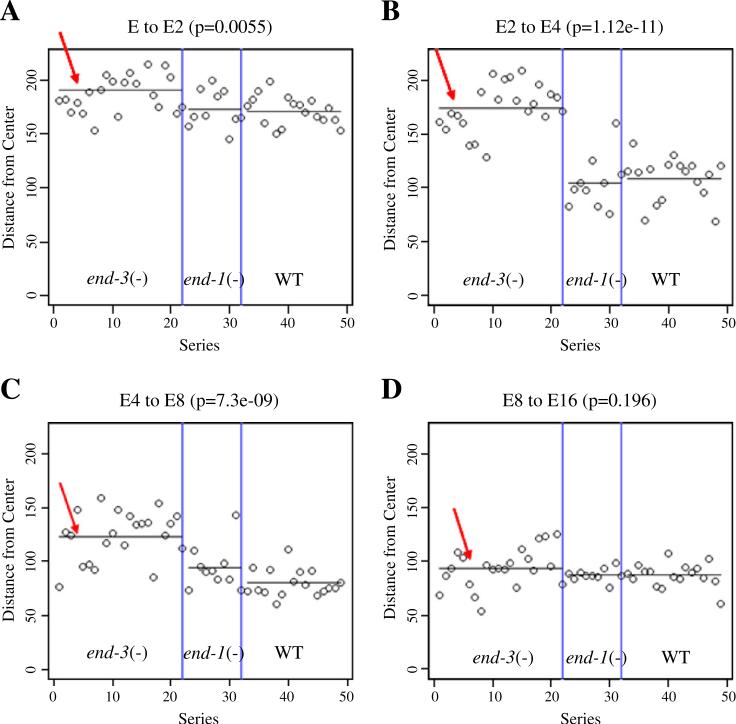
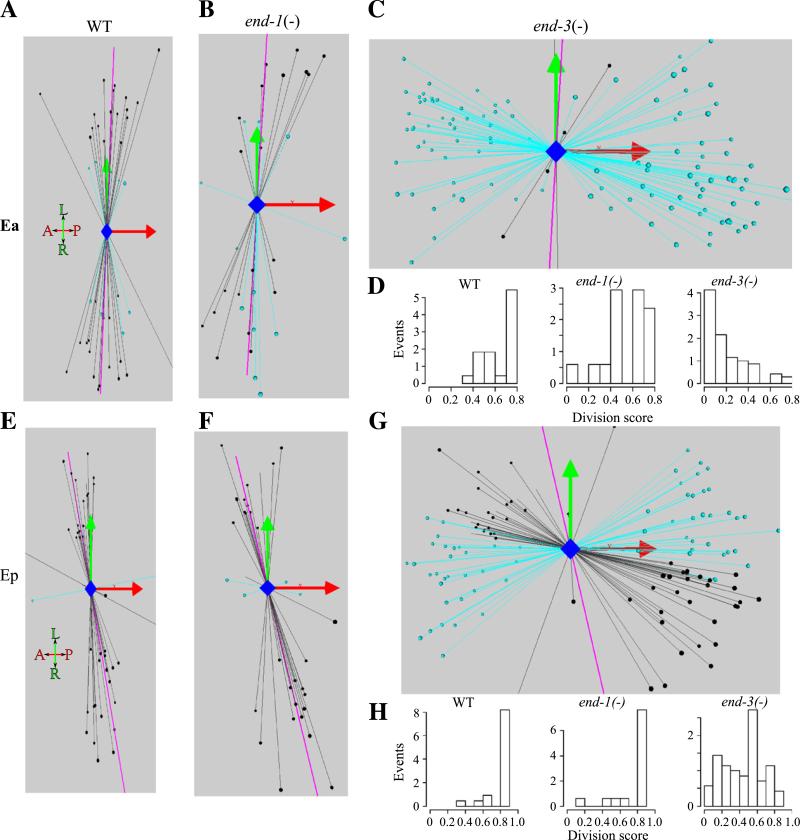
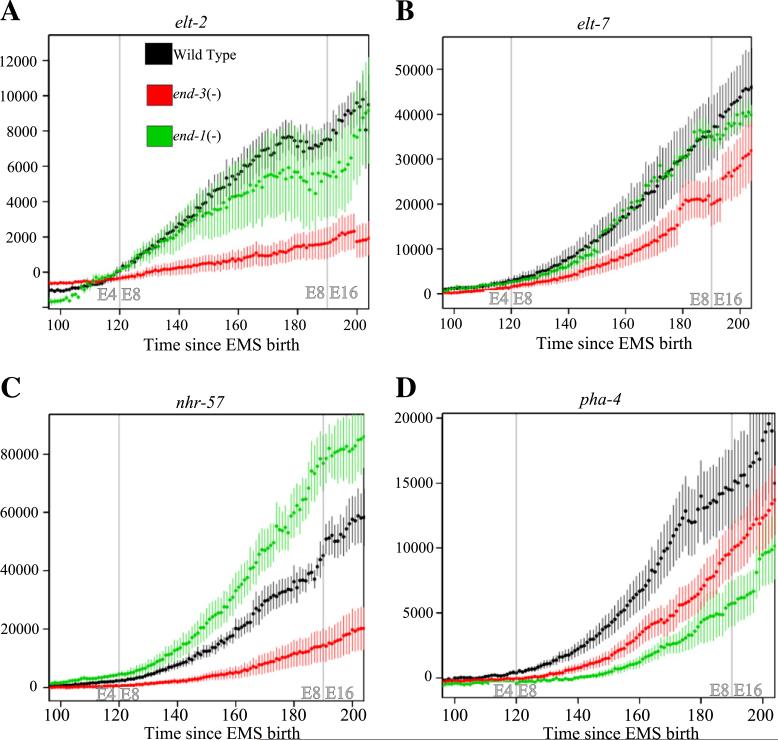
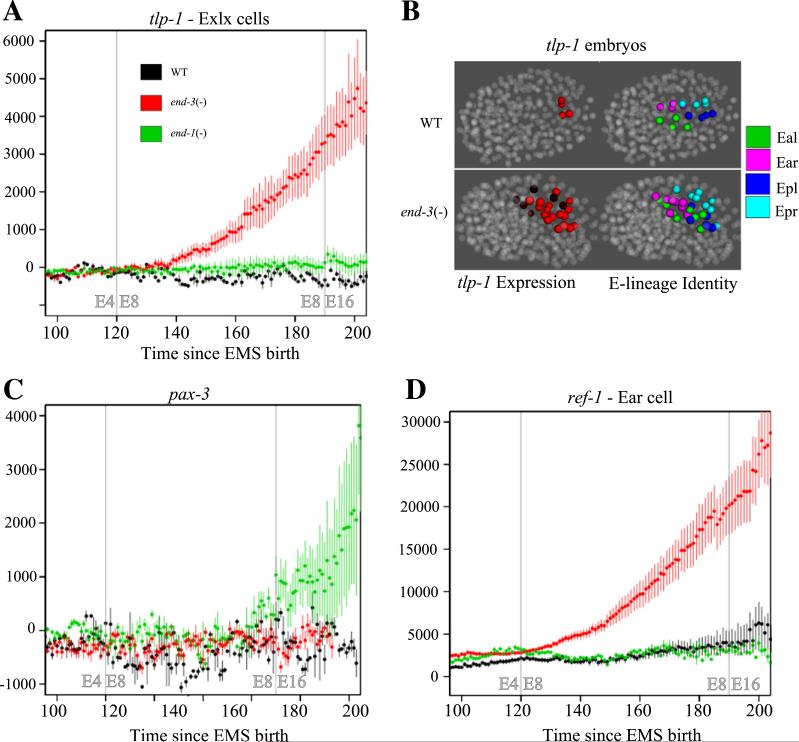
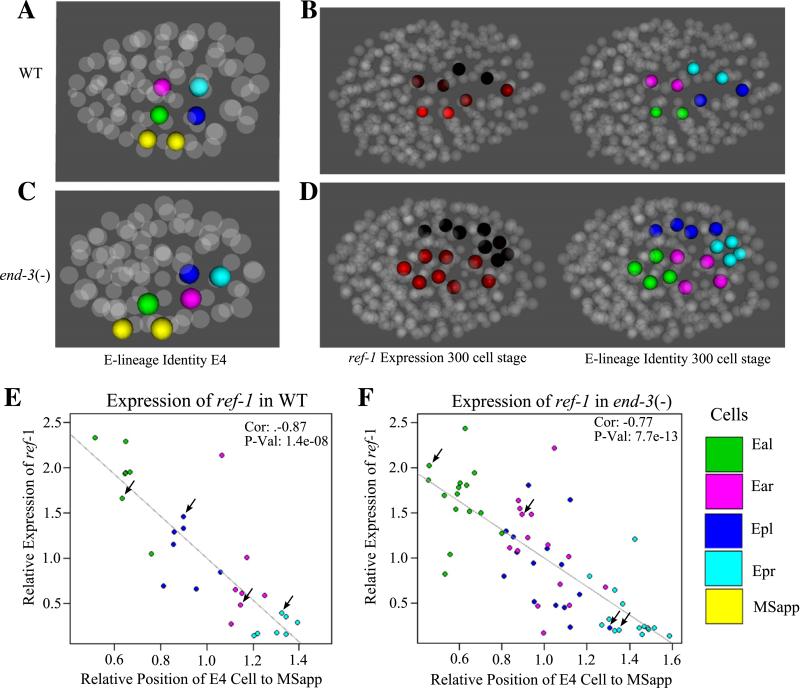
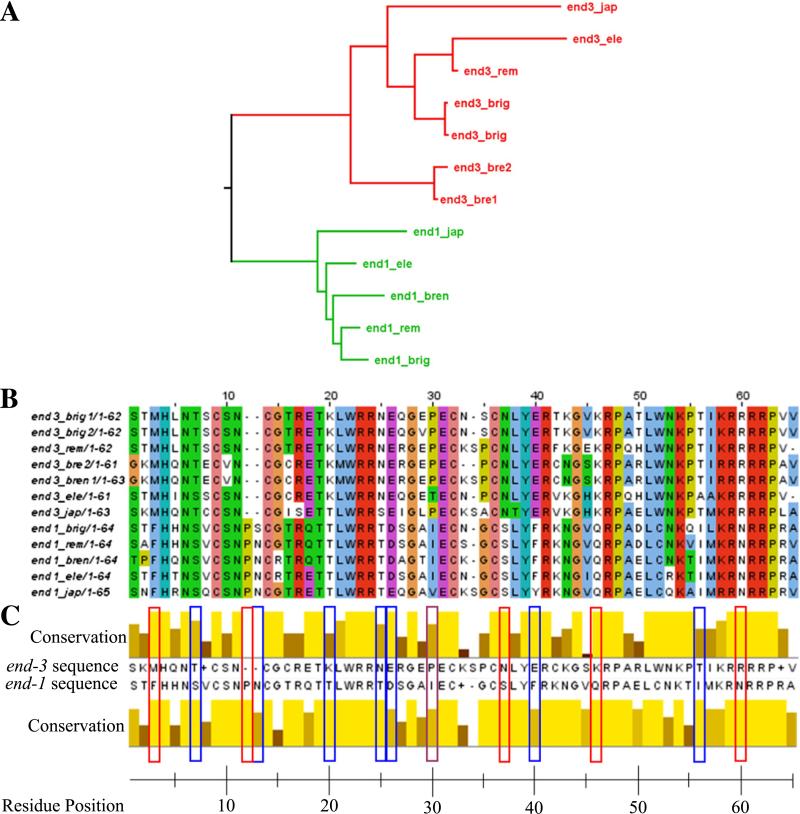
end-1 and end-3 are GATA transcription factors important for specifying endoderm cell fate in Caenorhabditis elegans. Deletion of both factors together results in larval arrest, 0% survival and a fate change in the endoderm-specifying E lineage. Individual deletions of either factor, however, result in the development of viable, fertile adults, with 100% of worms developing to adults for end-1(-) and 95% for end-3(-). We sought to quantify the variable phenotypes seen in both deletions using automated cell lineaging. We quantified defects in cell lifetime, cell movement and division axis in end-3(-) embryos, while quantifying perturbations in downstream reporter gene expression in strains with homozygous deletions for either gene, showing that each deletion leads to a unique profile of downstream perturbations in gene expression and cellular phenotypes with a high correlation between early and late defects. Combining observations in both cellular and gene expression defects we found that misaligned divisions at the E2 stage resulted in ectopic expression of the Notch target ref-1 in end-3(-) embryos. Using a maximum likelihood phylogenetic approach we found end-1 and end-3 split to form two distinct clades within the Caenorhabditis lineage with distinct DNA-binding structures. These results indicate that end-1 and end-3 have each evolved into genes with unique functions during endoderm development, that end-3(-) embryos have a delay in the onset of E lineage cell fate and that end-1 has only a partially penetrant ability to activate E lineage fate.


Figures

Fig. 1
Fig. 1
Deletion of end-3 leads to an acceleration of early E lineage cell divisions relative to WT. (A) Example of typical E lineage acceleration showing E lineage divisions relative to their sister lineage MS for wild type (left) and end-3(−) (right). Each box represents one cell lifetime with MS colored in green and E colored in pink. (B–H) The average cell lifetime for E lineage cells of end-3(−) (red), WT (gray), end-1(−) (green) and heterozygous deletion (blue) embryos. Each boxplot represents the cell lifetimes for a particular cell or set of cells. The total number of series used is shown after the color key. (B) Cell lifetimes for the E cell. (C and D) Cell lifetimes for the daughters of E: Ea and Ep. (E and F) Cell lifetimes for the daughters of Ea and Ep. (G and H) Cell lifetimes for the granddaughters of Ea and Ep.
Fig. 2
Fig. 2
Deletion of end-3 leads to a delay in gastrulation of the E lineage. Progress toward gastrulation was determined by taking the center of mass for a set of cells and measuring its distance from the center of the embryo. Each dot represents a single embryo. Measurements were taken (A) one time point prior to the division of E to Ex, (B) one time point prior to the beginning of the division of Ex to Exx (C) one time point prior to the beginning of the Exx to Exxx division and (D) one time point prior to the beginning of the Exxx to Exxxx division. The average distance from the center of the embryo is shown with a line for each strain (red arrow). P-values were calculated on the difference between the average distances of E-derived cells for the end-3(−) embryos as compared to WT, time of development was normalized to wild type for all embryos.
Fig. 3
Fig. 3
Deletion of end-3 leads to a highly penetrant and severe defect in the orientation of the division of the E2 cells. Each panel shows the division axis for a group of E2 cells in either WT, end-1(−) or end-3(−) embryos. The AP and LR axes are denoted by the red and the green arrows respectively with the DV axis shown in a blue line that is coming out of the panel. The average WT division axis is shown as a purple line in all panels. Divisions that are determined to be typical within a standard measure of variance are shown as black lines, while those divisions determined to be atypical are shown with light blue lines. (A–C) 3D representation of the Ea division in WT, end-1(−) and end-3(−) embryos respectively. (E–G) 3D representation of the Ep division in WT, end-1(−) and end-3(−) embryos respectively. (D and H) Each division score is plotted for WT, end-1(−) and end-3(−) in bar plots for both the Ea and Ep divisions respectively. All embryos have been normalized for orientation and size.
Fig 4
Fig 4
Alteration in transcription factor expression for end-3(−) and end-1(−) embryos. Deletion of end-3 leads to decreases in the expression of (A) elt-2, (B) elt-7, (C) nhr-57 and (D) pha-4 while deletion of end-1 leads to decreases only in elt-2 and pha-4 expression. Each graph shows the expression of fluorescent reporters in the E lineage for WT (black), end-1(−) (green) and end-3(−) (red) embryos. Single dots represent the average fluorescent intensity of each reporter for each treatment at a given point in development, colored lines are two standard error. Gray lines represent the beginning of the E4 to E8 and the E8 to E16 divisions in wild type.
Fig. 5
Fig. 5
Alteration in transcription factor expression for end-3(−) and end-1(−) embryos. end-3(−) embryos have increased expression of (A) tlp-1 and (D) ref-1 in a specific subset of cells while end-1(−) has increased expression of (C) pax-3 in the Earp cell. (A–C,D) Each graph shows the expression of fluorescent reporters in the E lineage in WT, end-1(−) and end-3(−) embryos. All coloring is the same as Fig. 4. (B) 3D representation of tlp-1 expression in the E lineage for WT and end-3(−) embryos. A typical WT embryo is shown above and an end-3(−) embryo below. On the left is a 3D representation of tlp-1 expression at a similar point in development for WT (top) and end-3(−) (bottom) embryos. Higher expression is denoted by cells by red intensity. On the right is a 3D representation of the same time point, this time with specific sublineages of E colored according to their identity with Eal = green, Ear = pink, Epl = blue and Epr = cyan.
Fig. 6
Fig. 6
Mislocalization of the E4 cells in end-3(−) embryos leads to an improper increase of ref-1 expression in Ear daughters along with a corresponding decrease in Epl daughters. (A–D) 3D representation of ref-1 expression in the E lineage for WT and end-3(−) embryos. (A and C) Position of E4 cells relative to the Notch-signaling cells MSapp and MSapa in WT and end-3(−) embryos. (B and D) Expression one cell cycle later (left) along with the corresponding cell identities (right). Higher ref-1 expression is shown by the level of red intensity. Cell identities (right) Eal = red, Ear = pink, Epl = blue, Epr = cyan and MSap = yellow. (E and F) Expression of ref-1 in E8 cells as a function of E4 proximity to MSapp. Cell identity is colored according to the legend in the bottom right of the figure. Expression and proximity are plotted as a ratio of the average for the E cells of individual embryos. WT is shown on the left and end-3(−) on the right. Arrows indicate cells from embryos shown in A and B.
Fig. 7
Fig. 7
end-1 and end-3 have unique phylogenies and GATA domain structures. (A) By using a maximum likelihood phylogenetic analysis end-1 and end-3 were found to have diverged into two distinct clades. Branch lengths represent total amino acid substitution rate for each domain protein. (B) Alignment of all the end-1 and end-3 genes found in Caenorhabditis, residues colored according to Clustal standard colors. (C) Consensus GATA domain for end-1 and end-3 as determined using Clustal. Highlighted in red boxes are those residues that are divergent between the end-1 end-3 clades, but with perfect conservation within the two clades. Those residues highlighted in blue boxes have a single difference in one clade and those residues highlighted in purple boxes have one difference in each clade.

Similar articles

Cited by

References

    1. Altschul S, Gish W, Miller W, Myers E, Lipman D. Basic local alignment search tool. J. Mol. Biol. 1990;215:403–410. - PubMed
    1. Anisimova M, Gascuel O. Approximate likelihood-ratio test for branches: a fast, accurate, and powerful alternative. Syst. Biol. 2006;55:539–552. - PubMed
    1. Bao Z, Murray J, Boyle T, Ooi S, Sandel M, Waterston R. Automated cell lineage tracing in Caenorhabditis elegans. Proc. Natl. Acad. Sci. U. S. A. 2006;103:2707–2712. - PMC - PubMed
    1. Baugh LR, Hill AA, Slonim AK, Brown EL, Hunter CP. Composition and dynamics of the Caenorhabditis elegans early embryonic transcriptome. Development. 2003;130(5):889–900. - PubMed
    1. Boyle T, Bao Z, Murray J, Araya C, Waterston R. AceTree: a tool for visual analysis of Caenorhabditis elegans embryogenesis. BMC Bioinforma. 2006;7:275. - PMC - PubMed

MeSH terms

Substances