. 2011 Nov;93(5):636-48.
doi: 10.1016/j.exer.2011.07.017. Epub 2011 Aug 16.

Cellular and 3D optical coherence tomography assessment during the initiation and progression of retinal degeneration in the Ccl2/Cx3cr1-deficient mouse

Affiliations

Cellular and 3D optical coherence tomography assessment during the initiation and progression of retinal degeneration in the Ccl2/Cx3cr1-deficient mouse

Yongdong Zhou et al. Exp Eye Res. 2011 Nov.

Abstract

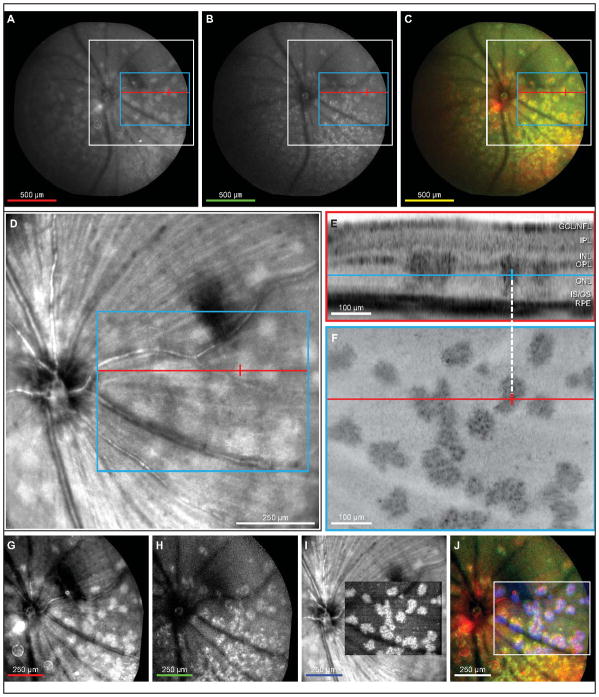
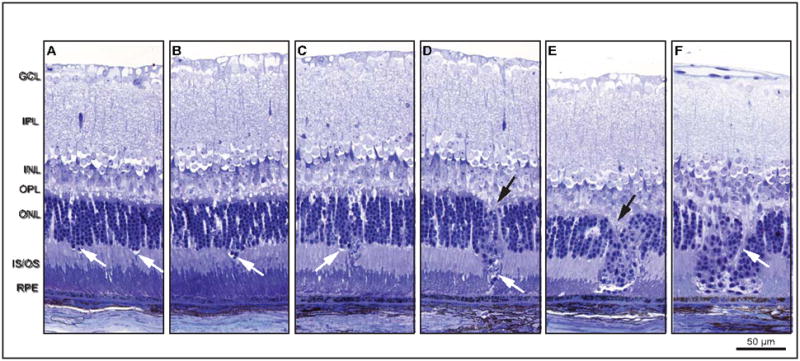
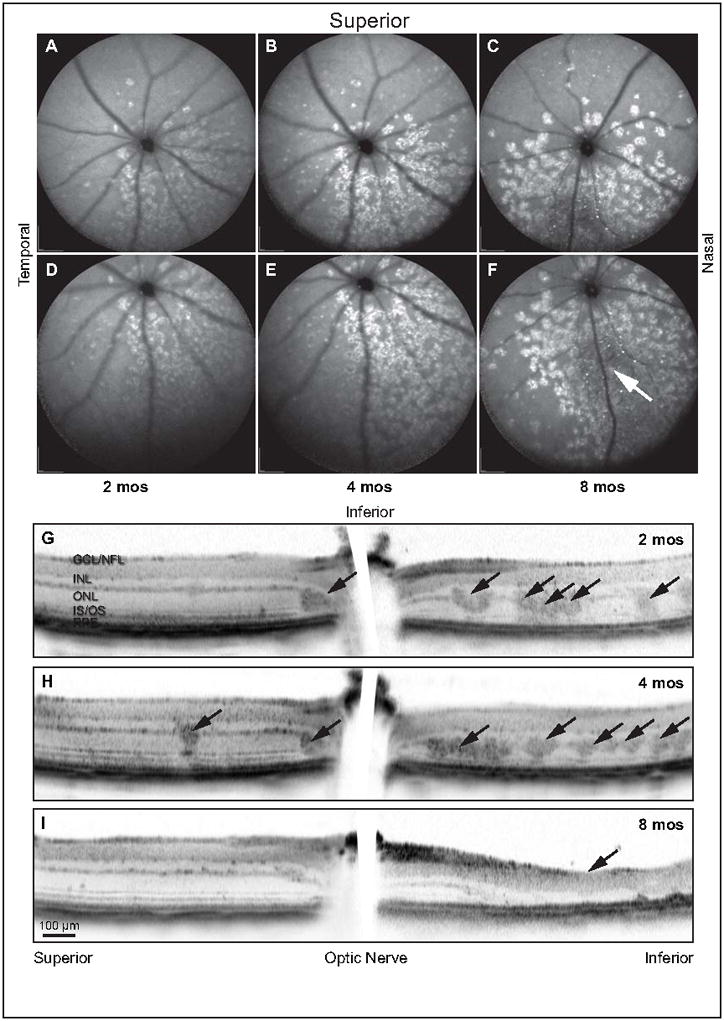
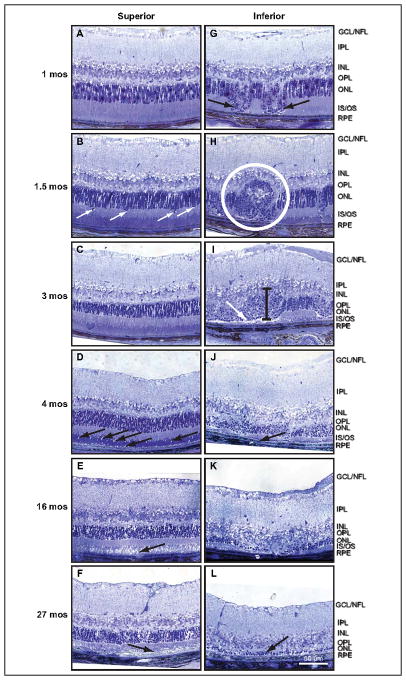
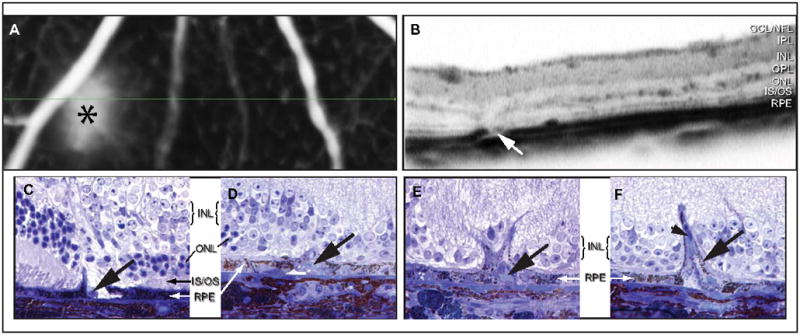
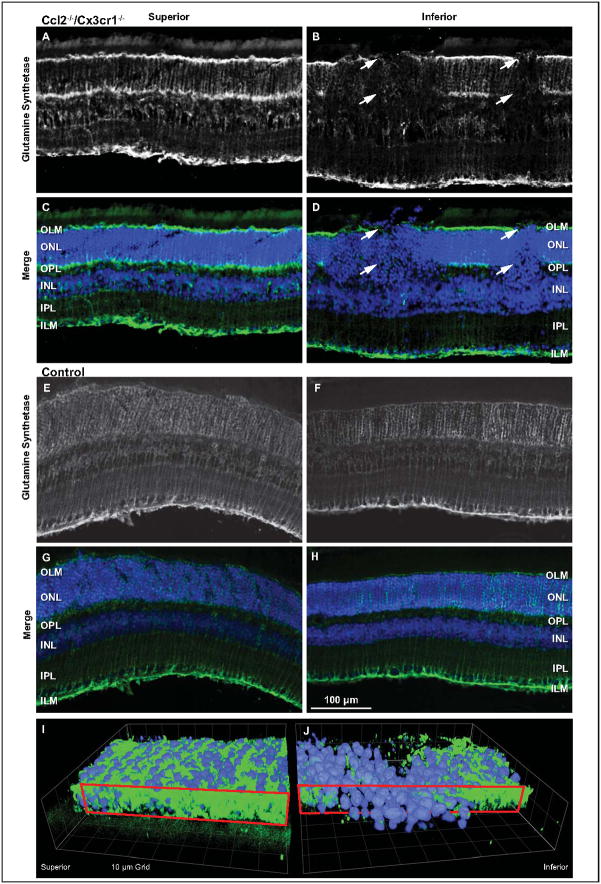
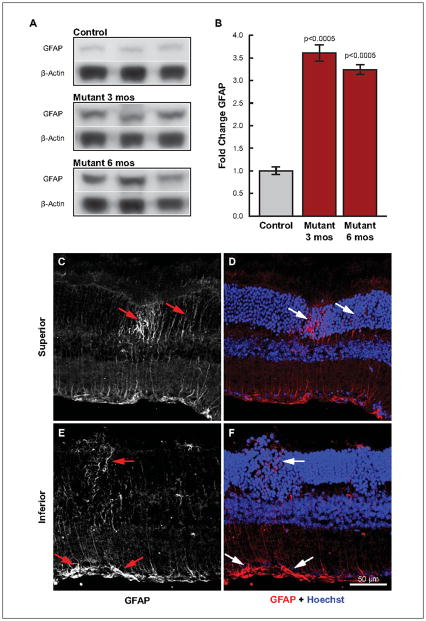
Retinal pathologies common to human eye diseases, including abnormal retinal pigment epithelial (RPE) cells, drusen-like accumulation, photoreceptor atrophy, and choroidal neovascularization, have been reported in the Ccl2/Cx3cr1-deficient mouse. The Ccl2 gene encodes the pro-inflammatory chemokine CCL2 (MCP-1), which is responsible for chemotactic recruitment of monocyte-derived macrophages to sites of inflammation. The Cx3cr1 gene encodes the fractalkine receptor, CX3CR1, and is required for accumulation of monocytes and microglia recruited via CCL2. Chemokine-mediated inflammation is implicated in retinal degenerative diseases such as diabetic retinopathy, age-related macular degeneration, retinitis pigmentosa, and uveoretinitis, and proper chemokine signaling from the RPE, Müller glia, and astrocytes is necessary to regulate leukocyte trafficking. Therefore, this mouse, possessing aberrant chemokine signaling coupled with retinal degenerative pathologies, presents an ideal opportunity to investigate the effect of altered signaling on retinal homeostasis and photoreceptor degeneration. Since this mouse is a recent development, more data covering the onset, location, and progression rate of pathologies is needed. In the present study we establish these parameters and show two photoreceptor cell death processes. Our observations of decreased glutamine synthetase and increased glial fibrillary acidic protein suggest that Müller cells respond very early within regions where lesions are forming. Finally, we suggest that retinal angiomatous proliferation contributes to pathological angiogenesis in this Ccl2/Cx3cr1-deficient mouse.


Figures

Figure 1
Figure 1
Lesions in outer nuclear layer of en face OCT co-localize with lesions in red-free and autofluorescent cSLO fundus exams. Widefield (55°) cSLO images were taken during a fundus exam of a 3-month-old DKO mouse (A–C). Irregular shaped lesions with uniform intensity are visible in a red-free cSLO image (A). An autofluorescent fundus image reveals similar irregular shapes as in A but with granular intensity patterns (B). Fundus images from A an B were registered and superimposed as red and green colors, respectively (C). Lesions observed in the red-free cSLO image colocalize with granular type lesions seen in the autofluorescent cSLO image (C). Red-free image obtained simultaneously during 3D SD-OCT (D) showing a 30° cSLO view which corresponds to the white box outline in A–C. Hyper-reflective lesions are visible in the outer nuclear layer of a single SD-OCT B-scan (E). The position of the B-scan, relative to the cSLO, is indicated by the redline (A–D, F). The blue line indicates retinal depth of the en face transform shown in F. Crossbar on blue line and white dashed line are registered with red crossbars (A-D, F) and indicates the center of a lesion in the outer nuclear layer. A single en face plane (F) transformed from the 3D SD-OCT data (blue box, A–D) through the outer nuclear layer (blue line, E) showing large irregular shaped lesions with a granular-like hyper-reflectivity similar in appearance to lesions seen in fundus autofluorescence. Contrast adjusted red-free image cropped from white boxed area in A (G). Contrast adjusted autofluorescent image cropped from white boxed area in B (H). Inverted and contrast adjusted en face OCT from F superimposed on the red-free cSLO image from D (I). Color merge of G, H and en face portion of I demonstrates that lesions observed in red-free and autofluorescent cSLO images colocalize with hyper-reflective lesions in en face OCT at the depth of the outer nuclear layer (J). Scalebar colors (A–C, G–J) represent the color of the respective image in the merged final (C, J). White box outline (A–C) indicates image area of D, G, and H. Blue box (AD) denotes region of image F. Red line (A–D, F) denotes SD-OCT B-scan position of E.
Figure 2
Figure 2
An assemblage of histologic micrographs illustrates lesion formation and progression. Lesions originate near the outer limiting membrane, followed by loss of inner and outer segments and movement of nuclei toward the retinal pigment epithelium. There is initial displacement of a column of ONL nuclei (2–3 nuclei wide) through the OLM toward the RPE (A), which is accompanied by a thin region of edema near the OLM (arrows). Outer and inner segment lengths appear relatively normal. Immediately distal to the lesion column, however, inner segments begin shortening. The OPL appears undisturbed. Displacement continues toward RPE with concomitant inner segment length reduction (B). Lesions retain discrete identity despite subsequent formation of adjacent lesions (C). The older lesion on the right contains many cellular fragments in the distal tip. Movement of ONL cell bodies distallytoward the RPE produces a gap in the OPL where several morphologically distinct nuclei are apparent (D, top arrow). Distally, inner segments are absent and outer segments contact the tip of the lesion (D, bottom arrow). Outer segments are shortened and vessiculated at their tips. As lesions progress to the level of the connecting cilium, cellular fragmentation increases and photoreceptor segments are lost. Note the newly developing lesion immediately to the left. Swelling and vessiculation disrupt the OPL and forms a wedge-like protrusion into the ONL (E, arrow). Lesions eventually fuse into large lesion complexes. Here, three lesions have fused into a single lesion complex with extensive cell debris along the right edge. Nuclear morphology within the lesion column is mixed, suggesting the presence of different cell types such as photoreceptors and immune cells (macrophage, neutrophil, and microglia). Finally, the OPL within the lesion site becomes disorganized (F). Swelling occurs at lesion front and a single row of nuclei becomes aligned along the RPE layer apical surface. Ultimately, processes originating from inner retina breach the large lesion complexes. (F, arrow).
Figure 3
Figure 3
Lesions form, initially, in the inferior hemisphere, increase with age, and ultimately result in degeneration of outer retina. The central fundus from Ccl2−/−/Cx3cr1−/− mice ranging 2 – 8 months of age were examined by autofluorescent cSLO. Lesions are principally confined to the inferior retina with only sporadic occurrence in superior retina (A–C). Lesion frequency increases with age from 2 – 8 months until virtually the entire inferior hemisphere is affected. Inferior autofluorescent fundus images of the same retinas (D–F) demonstrate that lesions extend to the far periphery of the inferior hemisphere. Loss of lesions is apparent in the central inferior portion of the 8-month-old mouse (F, arrow) and correlates to the region of severe retinal degeneration. Ccl2−/−/Cx3cr1−/− retinas imaged by SD-OCT along the vertical meridian passing through the optic nerve localized lesions within the photoreceptor layer (G–I). Occasional lesions are evident in the superior retina, but numerous lesions are apparent in the inferior retina at 2 (G, arrows) and 4 (H, arrows) months of age. By 8 months, lesions are replaced by severe degeneration of outer retina in the inferior hemisphere (I, arrow). This region of sever photoreceptor loss corresponds to the hypofluorescent region indicated in F (arrow).
Figure 4
Figure 4
Histologic sections corroborate SD-OCT observations. Focal lesions appear in the inferior hemisphere, increase with age, and result in degeneration of outer retina, thus confirming SD-OCT observations. Superior retina degenerates mildly with age. At 1 month, superior retina appears normal (A). Outer segments begin retracting at 1.5 months (B, arrows) and vessiculate by 3 months (C). Numerous focal edemas and outer segment shortening occurs by 4 months of age (D, arrows). At 16 months, the entire outer segment layer of superior retina exhibits severe edema (E, arrow). Photoreceptor inner segments become disorganized, outer segments are greatly reduced (F, arrow), and the ONL begins to thin by 27 months. In contrast, inferior retina develops large lesion complexes at 1 and 1.5 months of age (G, H, white circle). Inferior retinal lesions swell (see thicknessmarker) and become highly disorganized, with many constituent cells degenerating at 3 months (I). Edematous regions form near the RPE (arrow). At 4 months of age, only vestigial outer segments remain J, arrow) and little distinction between lesion and non-lesion regions exists. Outer segments and OPL are completely lost by 16 months and ONL is severely degenerated (K). Remarkably, 1–2 rows of outer nuclei are still present at 27 months in the inferior retina (L).
Figure 5
Figure 5
Retinal angiomatous proliferation and leakage is evident in areas of retinal degeneration of Ccl2−/−/Cx3cr1−/− mice. High-resolution fluorescein angiography reveals leakage in a 17-month-old Ccl2−/−/Cx3cr1−/− mouse (A, asterix). Simultaneous SD-OCT (B) identifies descending vasculature and RPE disruption (arrow) localized to the site of leakage. Histologic inspection of retinas with similar pathologies reveals focal RPE erosion and the presence of unknown cell types (C, arrow). RPE enclose these foreign cells (D, arrow) and create a barrier that encompasses retinal capillary outgrowths (E, arrow). In this study, no discontinuity of Bruch’s membrane was observed at any stage of this process. Retinal capillaries ultimately ramify into larger vessels that contact Bruch’s membrane and run parallel to its surface (F, arrow).
Figure 6
Figure 6
Müller cell involvement is associated with Ccl2−/−/Cx3cr1−/− lesions by a sharp reduction of glutamine synthetase (GS), a marker of healthy Müller cells. Retinas from 3-month-old Ccl2−/−/Cx3cr1−/− mice were sectioned and labeled for GS (green) and Hoechst (blue) (A–D). For clarity, GS labeling is represented monochromatically (A, B). The superior hemisphere (A, C) exhibits normal GS patterning with strong label at the OLM, OPL, and ILM. Additionally, vertical striations archetypical of Müller cell processes can be seen. In comparison to superior hemisphere, inferior hemisphere (B, D) revealed abnormal GS labeling. The OLM and OPL bands of the GS label were absent in lesion columns (arrows). The absence of GS at the region of the OLM coincided with distally displaced nuclei characteristic of the lesions. A similar comparison was made with C57BL/6 age-matched control mice. GS labeling appeared similar in both the superior (E, G) and inferior (F, H) retina. However, there was reduced labeling in the OLM and OPL within both retinal halves. As viewed from the RPE, a 3D reconstruction of the outer nuclear layer from a non-lesioned superior (I) and lesioned inferior retina (J) illustrates the disruption of the OLM (red boxed plane).
Figure 7
Figure 7
Elevated GFAP expression and focal increases indicate an early Müller cell response as lesion onset commences in Ccl2−/−/Cx3cr1−/− mice. Whole retinal lysates from Ccl2−/−/Cx3cr1−/− mice immuno-blotted with GFAP and β-Actin (A) demonstrate a significant increase in GFAP expression at 3 and 6 months of age as compared to 3.5 month old wild type controls; bar graph (B). Immunofluorescence of GFAP in superior (C, D) and inferior (E, F) retina demonstrates that GFAP immunoreactivity is apparent within the inner processes of Müller cells in regions within, and immediately surrounding focal lesions of inner retina (E, F). More importantly, focal increases of GFAP very early in lesion development suggest Müller cell sensitivity to signals initiating photoreceptor degeneration (C, D, white arrows). C and E are monochromatic images from D and F, respectively.

Similar articles

Cited by

References

    1. Bai Y, Ma JX, Guo J, Wang J, Zhu M, Chen Y, Le YZ. Müller cell-derived VEGF is a significant contributor to retinal neovascularization. J Pathol. 2009;219:446–454. - PubMed
    1. Campbell M, Humphries M, Kennan A, Kenna P, Humphries P, Brankin B. Aberrant retinal tight junction and adherens junction protein expression in an animal model of autosomal recessive Retinitis pigmentosa: The Rho(−/−) mouse. Exp Eye Res. 2006;83:484–492. - PubMed
    1. Cardona AE, Pioro EP, Sasse ME, Kostenko V, Cardona SM, Dijkstra IM, Huang D, Kidd G, Dombrowski S, Dutta R, Lee JC, Cook DN, Jung S, Lira SA, Littman DR, Ransohoff RM. Control of microglial neurotoxicity by the fractalkine receptor. Nat Neurosci. 2006;9:917–924. - PubMed
    1. Carter DA, Dick AD. CD200 maintains microglial potential to migrate in adult human retinal explant model. Curr Eye Res. 2004;28:427–436. - PubMed
    1. Chan CC, Tuo J, Bojanowski CM, Csaky KG, Green WR. Detection of CX3CR1 single nucleotide polymorphism and expression on archived eyes with age-related macular degeneration. Histol Histopathol. 2005;20:857–863. - PMC - PubMed

Publication types

MeSH terms