. 2011 Dec;61(8):1334-44.
doi: 10.1016/j.neuropharm.2011.08.006. Epub 2011 Aug 16.

Differential effects of mGluR7 and mGluR8 activation on pain-related synaptic activity in the amygdala

Affiliations

Differential effects of mGluR7 and mGluR8 activation on pain-related synaptic activity in the amygdala

Wenjie Ren et al. Neuropharmacology. 2011 Dec.

Abstract

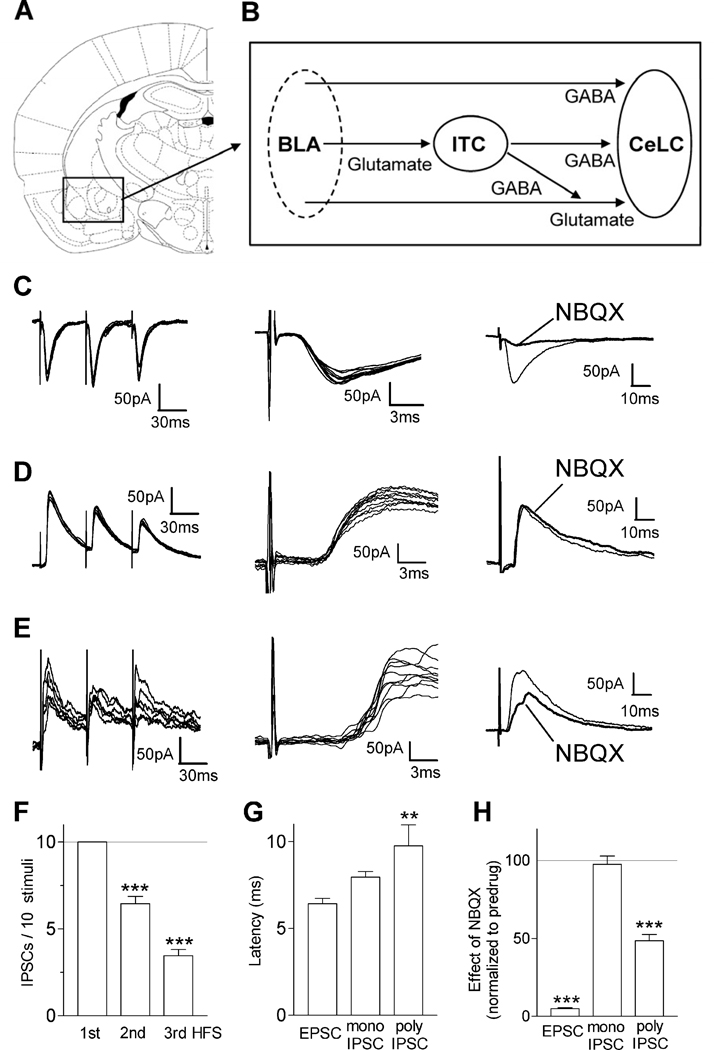
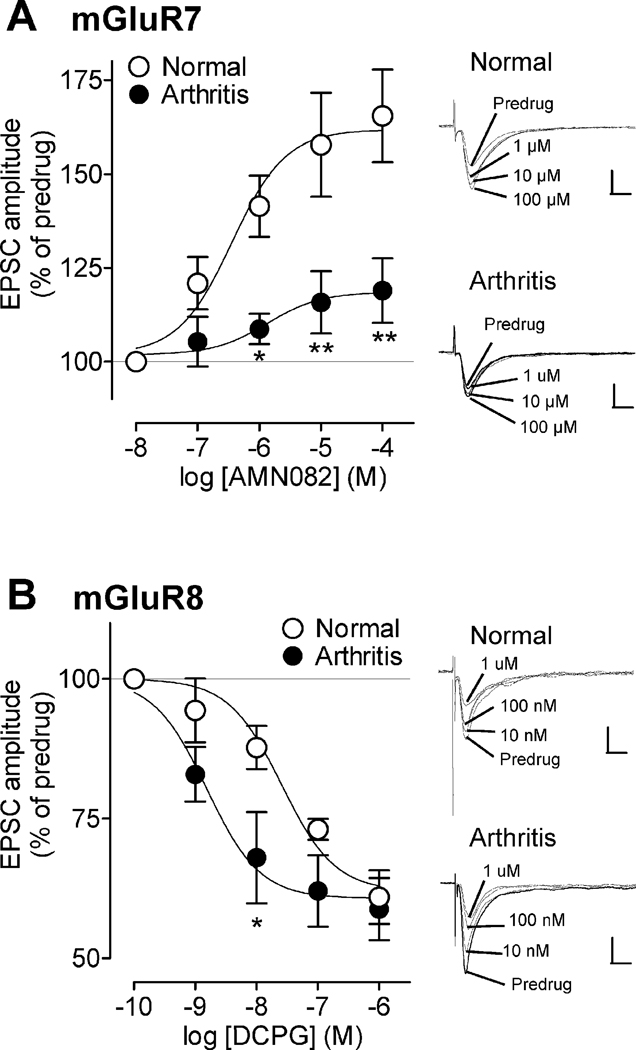
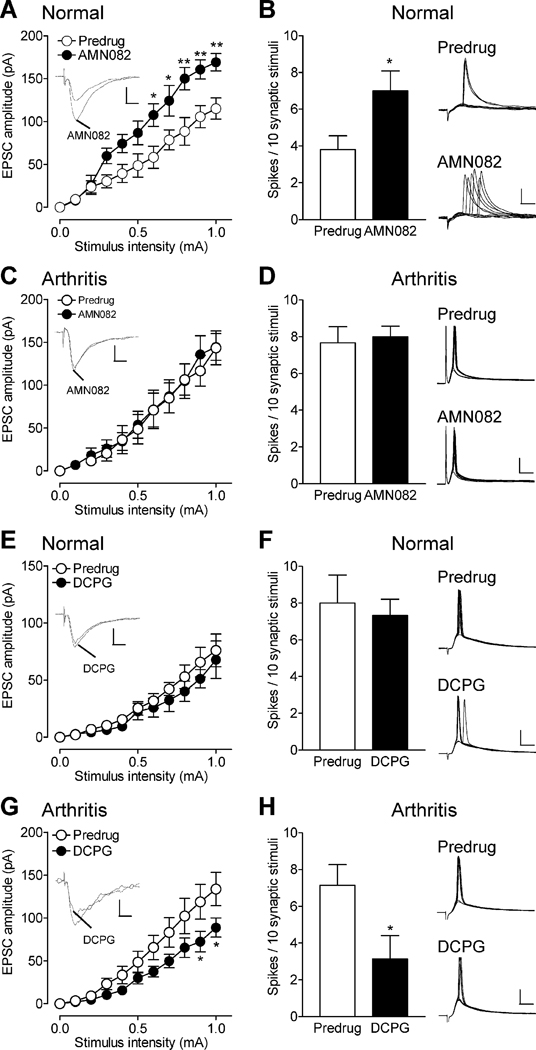
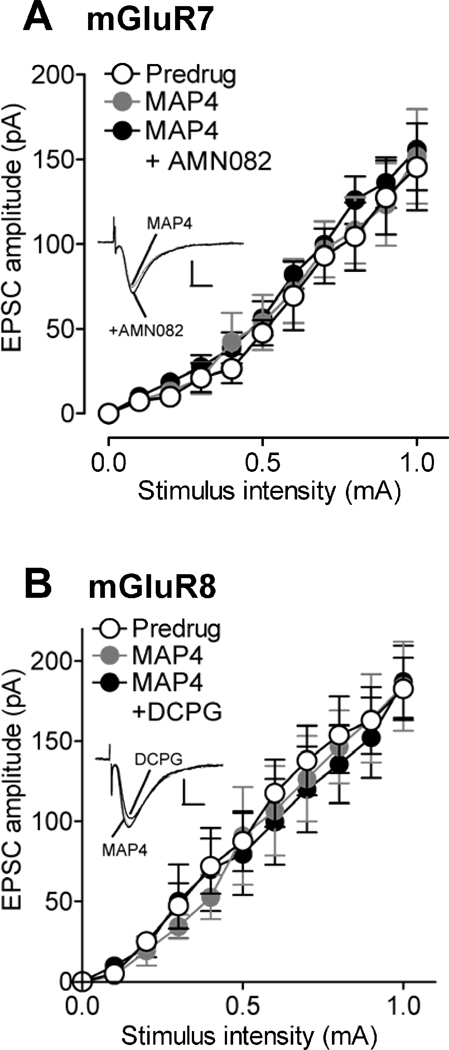
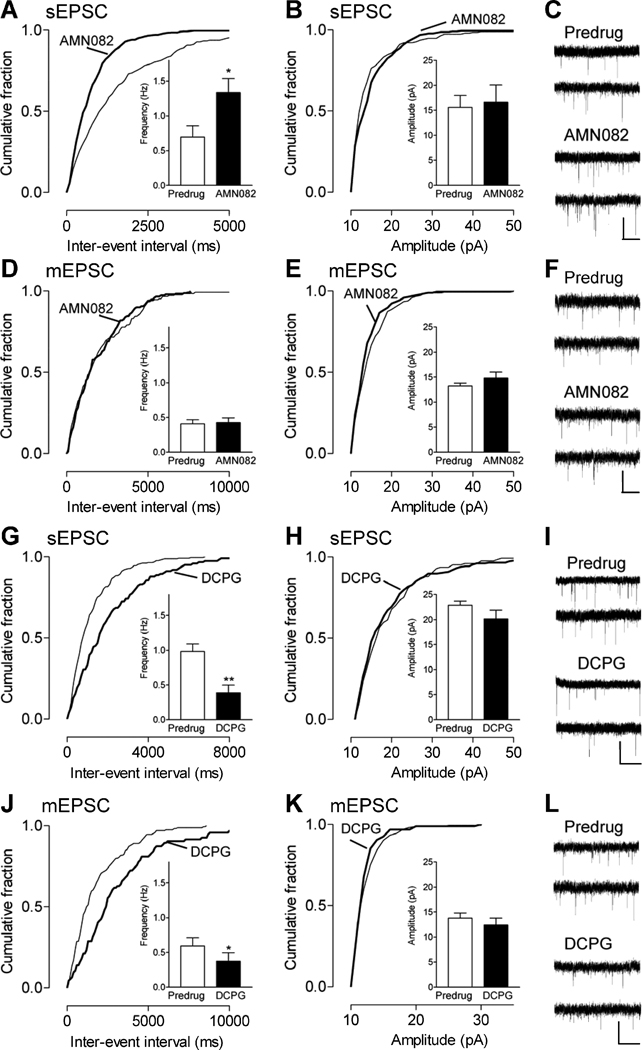
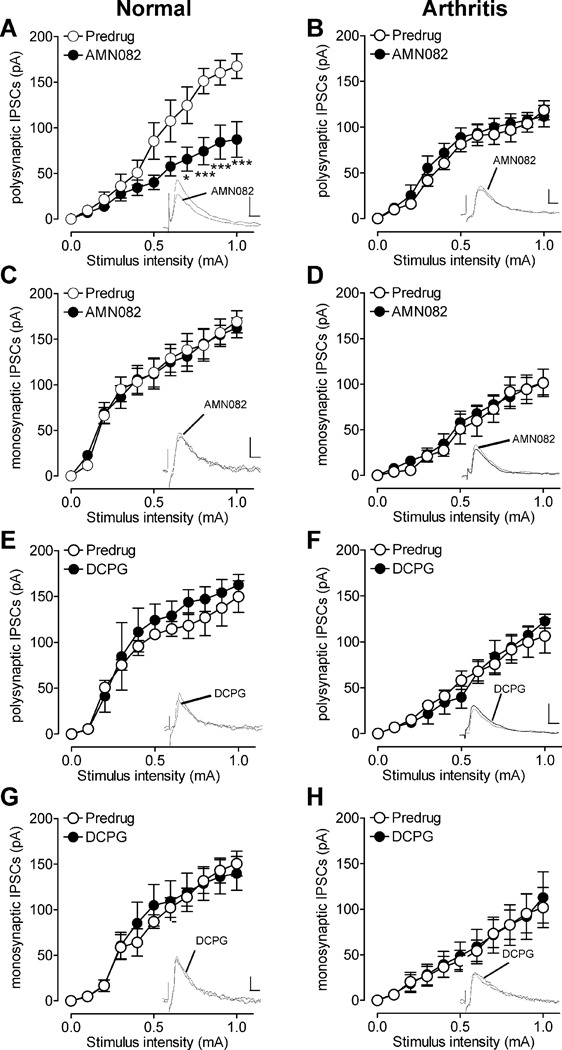
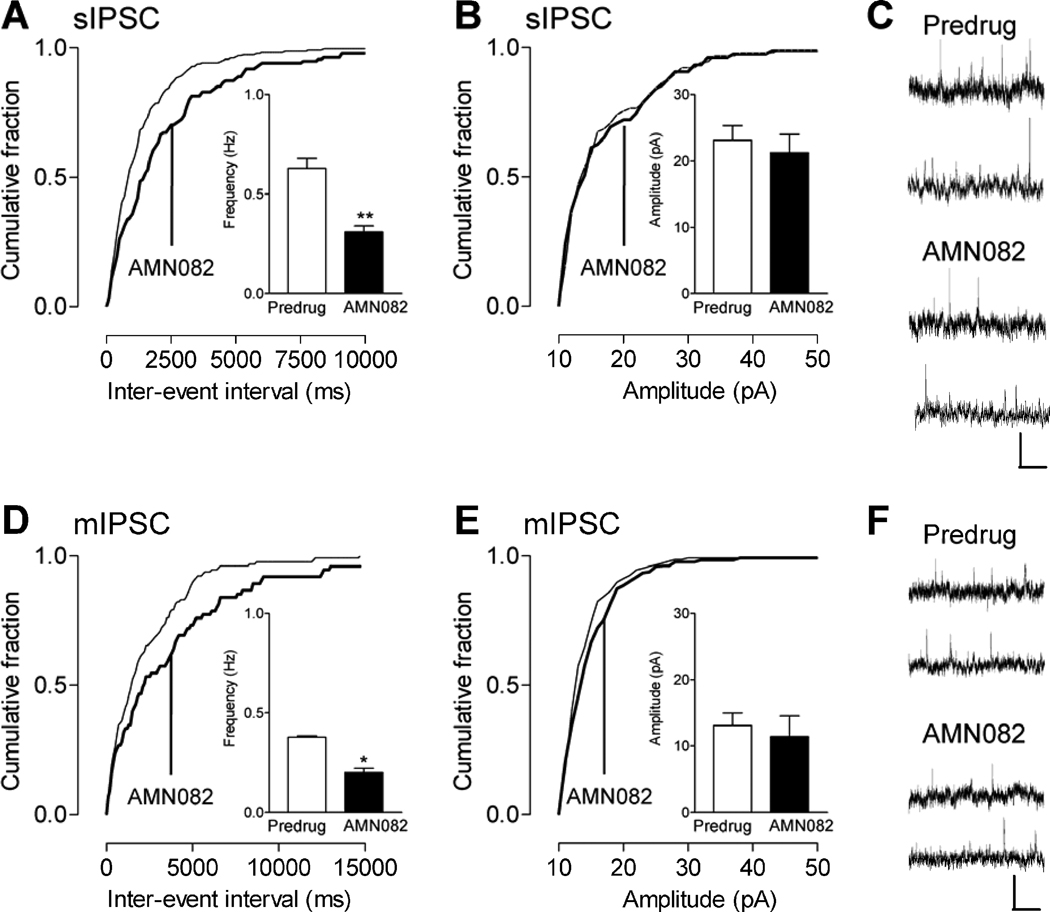
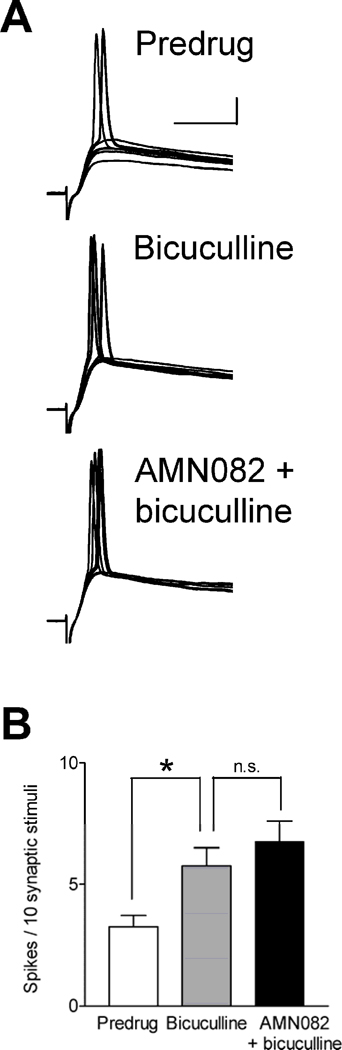
Pain-related plasticity in the laterocapsular division of the central nucleus of the amygdala (CeLC) depends on the activation of group I metabotropic glutamate receptors (mGluRs) whereas groups II and III mGluRs generally serve inhibitory functions. Recent evidence suggests differential roles of group III subtypes mGluR7 (pain enhancing) and mGluR8 (pain inhibiting) in the amygdala (Palazzo et al., 2008). Here we addressed the underlying synaptic mechanisms of mGluR7 and mGluR8 function in the CeLC under normal conditions and in an arthritis pain model. Using patch-clamp recordings in rat brain slices, we measured monosynaptic excitatory post-synaptic currents (EPSCs), mono- and polysynaptic inhibitory synaptic currents (IPSCs), and synaptically evoked action potentials (E-S coupling) in CeLC neurons. Synaptic responses were evoked by electrical stimulation in the basolateral amygdala (BLA). A selective mGluR8 agonist (DCPG) inhibited evoked EPSCs and synaptic spiking more potently in slices from arthritic rats than in slices from normal rats. In contrast, a selective mGluR7 agonist (AMN082) increased EPSCs and E-S coupling in slices from normal rats but not in the pain model. The effects of AMN082 and DCPG were blocked by a group III antagonist (MAP4). AMN082 increased frequency, but not amplitude, of spontaneous EPSCs but had no effect on miniature EPSCs (in TTX). DCPG decreased frequency, but not amplitude, of spontaneous and miniature EPSCs. The data suggest that mGluR8 acts presynaptically to inhibit excitatory transmission whereas the facilitatory effects of mGluR7 are indirect through action potential-dependent network action. AMN082 decreased evoked IPSCs and frequency, but not amplitude, of spontaneous and miniature IPSCs in slices from normal rats. DCPG had no effect on inhibitory transmission. The results suggest that presynaptic mGluR7 inhibits inhibitory synaptic transmission to gate glutamatergic transmission to CeLC neurons under normal conditions but not in pain. Presynaptic mGluR8 inhibits pain-related enhanced excitatory transmission in the CeLC.


Figures

Figure 1
Figure 1. Synaptic transmission between BLA and CeLC
(A) Coronal brain slices containing the amygdala were obtained from normal rats and from arthritic rats. (B) Connections between BLA and CeLC include direct glutamatergic input to the CeLC, direct GABAergic input to the CeLC, and indirect GABAergic input provided by neurons of the intercalated cell masses (ITC). Stimulation electrode was positioned in the BLA. Patch-clamp recordings were made from CeLC neurons. (C) Monosynaptic excitatory postsynaptic currents (EPSCs, recorded at −70 mV) followed high-frequency stimulation (20 Hz; 6 individual traces each; left), showed constant latency (2x threshold stimulation intensity; 10 individual traces; middle), and were blocked by NBQX (10 µM; right). (D) Monosynaptic inhibitory postsynaptic currents (IPSCs, recorded at 0 mV) followed high-frequency stimulation (20 Hz), had constant latency (10 traces), and were not affected by NBQX. (E) Polysynaptic inhibitory postsynaptic currents (IPSCs, recorded at 0 mV) did not consistently follow high-frequency stimulation (20 Hz), had variable latencies (10 traces), and were partially inhibited by NBQX, suggesting that polysynaptic IPSCs are driven by non-NMDA receptors. (F) Bar histograms show the number of polysynaptic IPSCs evoked by the 1st, 2nd and 3rd stimulus of a high-frequency stimulus train (HFS, 20 Hz) averaged across the sample of neurons (n = 20; *** P < 0.001, compared to 1st stimulus [no failure], Bonferroni posttests). (G) Bar histograms show average latencies of EPSCs and IPSCs (n = 10 neurons, ** P < 0.01, compared to 1st stimulus, Bonferroni posttests). (H) Bar histograms show effect of NBQX (10 µM) expressed as percent of predrug values (set to 100%; n = 10 neurons, *** P < 0.001, compared to predrug, paired t-test). Symbols and error bars represent means ± SE.
Figure 2
Figure 2. Differential effects of mGluR7 and mGluR8 on excitatory synaptic transmission in CeLC neurons
(A) Cumulative concentration–response relationships for a selective mGluR7 agonist (AMN082). AMN082 increased EPSC peak amplitudes under normal conditions but had significantly weaker effects in slices from arthritis rats (n = 5 neurons in each group). (B) Cumulative concentration–response relationships for a selective mGluR8 agonist (DCPG). DCPG inhibited EPSCs more potently in slices from arthritic rats than in slices from normal rats (n = 4 neurons in each group). (A, B) Symbols represent means ± SE. Sigmoid curves were fitted through the data points using nonlinear regression analysis (GraphPad Prism software; see Methods). Traces on the right show the average of 6–8 EPSCs evoked before (Predrug) and during application of different drug concentrations in individual CeLC neurons in slices from normal and arthritic rats. Stimulus intensity, 0.9 mA. Scale bars, 50 pA, 10 ms.*,**, P < 0.05, 0.01 (Bonferroni posttests, arthritis compared to normal; see text for details).
Figure 3
Figure 3. Effects of mGluR7 and mGluR8 on excitatory transmission and synaptically evoked spiking in CeLC neurons under normal conditions and in a model of arthritic pain
A selective mGluR7 agonist (AMN082, 10 µM) significantly enhanced input-output (I/O) functions of monosynaptic EPSCs (A) and the number of synaptically evoked action potentials (B) in CeLC neurons in slices from normal rats (n = 10 neurons). AMN082 had no effect on EPSCs (C) and on synaptically evoked action potentials (D) in slices from arthritic rats (n = 10 neurons). A selective mGluR8 agonist (DCPG, 10 nM) had no effect on EPSCs (E) and synaptically evoked spiking (F) in slices from normal rats (n = 8 neurons). DCPG significantly decreased I/O functions of monosynaptic EPSCs (G) and the number of synaptically evoked action potentials (H) in CeLC neurons in slices from arthritic rats (n = 6 neurons). (A, C, E, G) I/O relationships were obtained in voltage-clamp by measuring peak amplitudes of EPSCs as a function of afferent fiber stimulus intensity in the absence and presence of AMN082 or DCPG. Individual traces show EPSCs (average of 8–10) evoked with a stimulation intensity of 0.9 mA. Scale bars, 50 pA, 10 ms. (B, D, F, H) Bar histograms show number of action potentials (spikes) in current-clamp (initial membrane potential, −60 mV) evoked by 10 synaptic stimuli (averaged across the sample of neurons). Individual traces are synaptically evoked spikes before (Predrug) and during drug application (10 stimuli). Scale bars, 20 mV, 5 ms. Symbols and error bars represent means ± SE. *,** P < 0.05, 0.01 (Bonferroni posttest in A, C, E, G; paired t-test in B, D, F, H).
Figure 4
Figure 4. The effects of mGluR7 and mGluR8 agonists are blocked by a group III mGluR antagonist
(A) A selective group III mGluR antagonist (MAP4, 500 µM) had no effect on its own but blocked the facilitatory effect of AMN082 (10 µM) on I/O function of EPSCs (see Fig. 3) in slices from normal rats (n = 5 neurons). (B) MAP4 (500 µM) also blocked the inhibitory effect of DCPG (10 nM) on EPSCs evoked in slices from arthritic rats (n = 4 neurons). (A, B) Symbols represent means ± SE. Traces show the average of 6–8 EPSCs evoked before and during drug application in individual CeLC neurons. Stimulus intensity, 0.9 mA. Scale bars, 50 pA, 10 ms.
Figure 5
Figure 5. Effects of mGluR7 and mGluR8 agonists on spontaneous and miniature EPSCs in CeLC neurons
(A–C) Cumulative distribution analysis of frequency (A) and amplitude (B) of spontaneous EPSCs (sEPSCs) in slices from normal rats. AMN082 (10 µM) caused a significant shift toward smaller inter-event intervals (P < 0.05, Kolmogorov–Smirnov [K-S] test), thus increasing the mean frequency significantly (n = 5 neurons, P < 0.05, paired t-test), but had no effect on sEPSC amplitude. (C) Current traces of sEPSCs in an individual CeLC neuron before (Predrug) and during AMN082. (D–F) AMN082 had no significant effect on frequency (D) and amplitude (E) of miniature EPSCs (mEPSCs) (n = 6 neurons, P > 0.05, K-S test for cumulative distribution and paired t-test for mean frequency and amplitude). (F) Current traces of mEPSCs (in TTX, 1 µM) recorded in an individual CeLC neuron before (Predrug) and during AMN082. (G–I) DCPG (10 nM) decreased frequency (G), but not amplitude (H), of sEPSCs significantly (n = 7 neurons, cumulative frequency distribution, P < 0.05, K-S test; mean frequency, P < 0.01, paired t-test). Recordings were made in slices from arthritic rats. (I) Current traces of sEPSCs recorded in one CeLC neuron before (Predrug) and during DCPG. (J–L) DCPG significantly decreased frequency (J), but not amplitude (K) of mEPSCs (n = 5 neurons, cumulative frequency distribution, P < 0.05, K-S test; mean frequency, P < 0.05, paired t-test). (L) Current traces of mEPSCs in the presence of TTX (1 µM) in one CeLC neuron before (Predrug) and during DCPG. Bar histograms show means ± SE. Scale bars for current traces, 10 pA, 2 s.
Figure 6
Figure 6. Effects of mGluR7 and mGluR8 agonists on inhibitory synaptic transmission in CeLC neurons under normal conditions and in a model of arthritic pain
I/O relationships for IPSCs were obtained in voltage-clamp at 0 mV (same analysis as in Fig. 3 for EPSCs) in slices from normal rats (A, C, E, G) and from arthritic rats (B, D, F, H). (A) AMN082 (10 µM) significantly decreased polysynaptic inhibitory transmission in slices from normal rats (n = 5 neurons). (B) AMN082 had no effect on polysynaptic IPSCs in slices from arthritic rats (n = 5 neurons). (C, D) AMN082 (10 µM) had no significant effect on monosynaptic IPSCs under normal conditions (n = 5 neurons, C) and in the arthritis model (n = 5 neurons, D). (E, F) DCPG (10 nM) had no significant effect on polysynaptic IPSCs in slices from normal rats (n = 4 neurons, E) and from arthritic rats (n = 4 neurons, F). (G, H) DCPG (10 nM) had no effect on monosynaptic IPSCs in slices from normal rats (n = 4 neurons, G) and in slices from arthritic rats (n = 4 neurons, H). Symbols and error bars represent means ± SE. Individual traces show IPSCs evoked in individual CeLC neurons before (Predrug) and during drug application. Stimulus intensity, 0.9 mA. Scale bars, 50 pA, 10 ms. *,*** P < 0.05, 0.001 (compared to predrug values, Bonferroni posttests).
Figure 7
Figure 7. Effects of an mGluR7 agonist on spontaneous and miniature IPSCs in CeLC neurons
(A–C) Cumulative distribution analysis of frequency (A) and amplitude (B) of spontaneous IPSCs (sIPSCs). AMN082 (10 µM) decreased frequency (A), but not amplitude (B), of sIPSCs significantly (cumulative frequency distribution, P < 0.05, K-S test; mean frequency, P < 0.01, paired t-test; n = 4 neurons). (C) Current traces of sIPSCs in an individual CeLC neuron before (Predrug) and during AMN082. (D–E) AMN082 (10 µM) also decreased frequency (D), but not amplitude (E), of mIPSCs significantly (cumulative frequency distribution, P < 0.05, K-S test; mean frequency, P < 0.05, paired t-test; n = 4 neurons). (F) Current traces of mIPSCs (in TTX, 1 µM) recorded in an individual CeLC neuron before (Predrug) and during AMN082. Bar histograms show means ± SE. Scale bars for current traces, 10 pA, 2 s. Recordings were made in slices from normal rats.
Figure 8
Figure 8. Blockade of GABAA receptors occludes the facilitatory effects of mGluR7 activation on CeLC output
Current-clamp recordings (initial holding potential, −60 mV) of synaptically evoked action potentials in CeCL in slices from normal rats. (A) Traces show synaptically evoked responses (10 stimuli) in an individual CeLC neuron before (Predrug) and during application of a GABAA receptor antagonist (bicuculline, 10 µM) and during coapplication of bicuculline with AMN082 (10 µM). Scale bars, 20 mV, 20 ms. (B) Bar histograms (mean ± SE) show that bicuculline (10 µM) increased the number of synaptically evoked action potentials in CeLC neurons significantly (n = 4 neurons, P < 0.05, Bonferroni posttests). Coapplication of AMN082 (10 µM) with bicuculline had no significant (n.s.) additional effect (P > 0.05, Bonferroni posttest).

Similar articles

Cited by

References

    1. Adedoyin MO, Vicini S, Neale JH. Endogenous N-acetylaspartylglutamate (NAAG) inhibits synaptic plasticity/transmission in the amygdala in a mouse inflammatory pain model. Mol. Pain. 2010;6:60. - PMC - PubMed
    1. Ansah OB, Bourbia N, Goncalves L, Almeida A, Pertovaara A. Influence of amygdaloid glutamatergic receptors on sensory and emotional pain-related behavior in the neuropathic rat. Behav. Brain Res. 2010;209:174–178. - PubMed
    1. Anwyl R. Metabotropic glutamate receptors: electrophysiological properties and role in plasticity. Brain Res Brain Res Rev. 1999;29:83–120. - PubMed
    1. Apkarian AV, Baliki MN, Geha PY. Towards a theory of chronic pain. Prog. Neurobiol. 2009;87:81–97. - PMC - PubMed
    1. Ayala JE, Niswender CM, Luo Q, Banko JL, Conn PJ. Group III mGluR regulation of synaptic transmission at the SC-CA1 synapse is developmentally regulated. Neuropharmacology. 2008;54:804–814. - PMC - PubMed

MeSH terms

Substances