. 2012 Jan 18;105(2):305-14.
doi: 10.1016/j.physbeh.2011.08.005. Epub 2011 Aug 11.

Dehydration-anorexia derives from a reduction in meal size, but not meal number

Affiliations

Dehydration-anorexia derives from a reduction in meal size, but not meal number

Christina N Boyle et al. Physiol Behav. .

Abstract

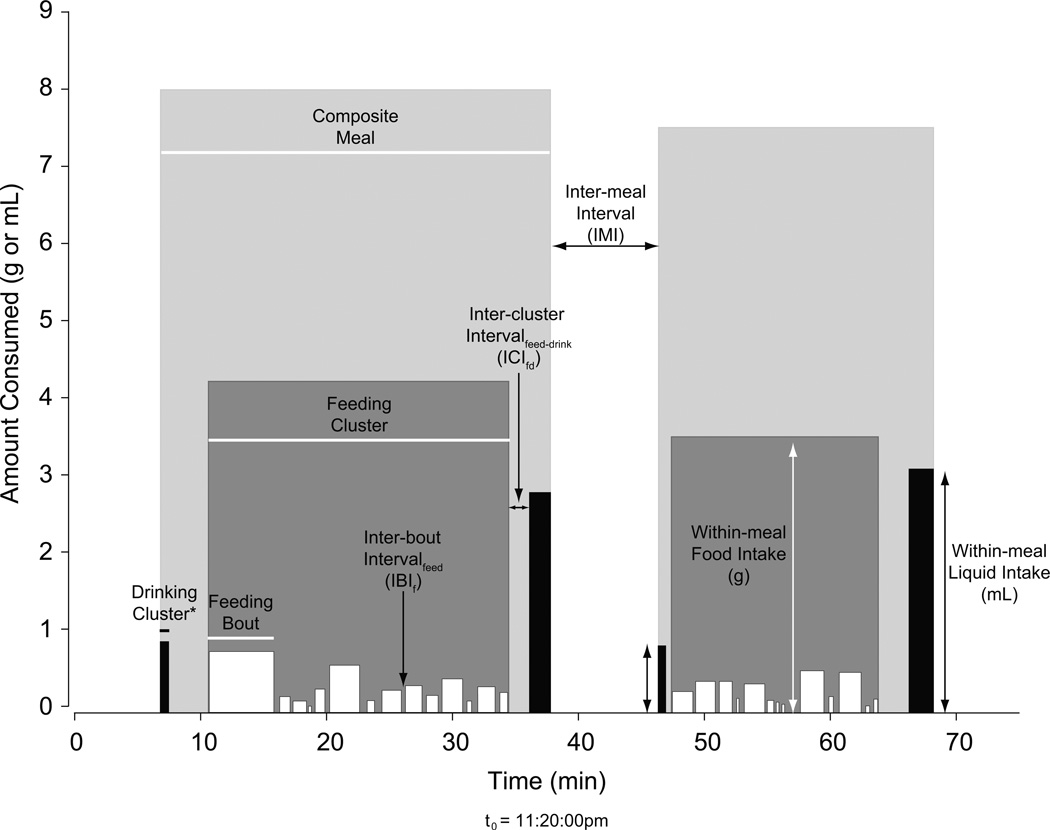
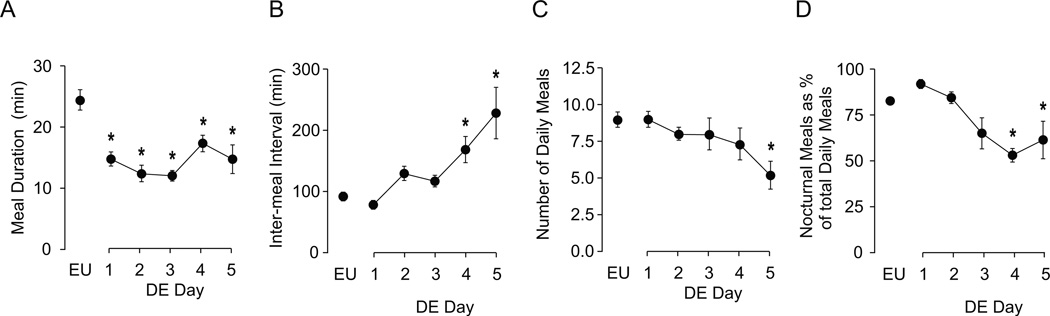
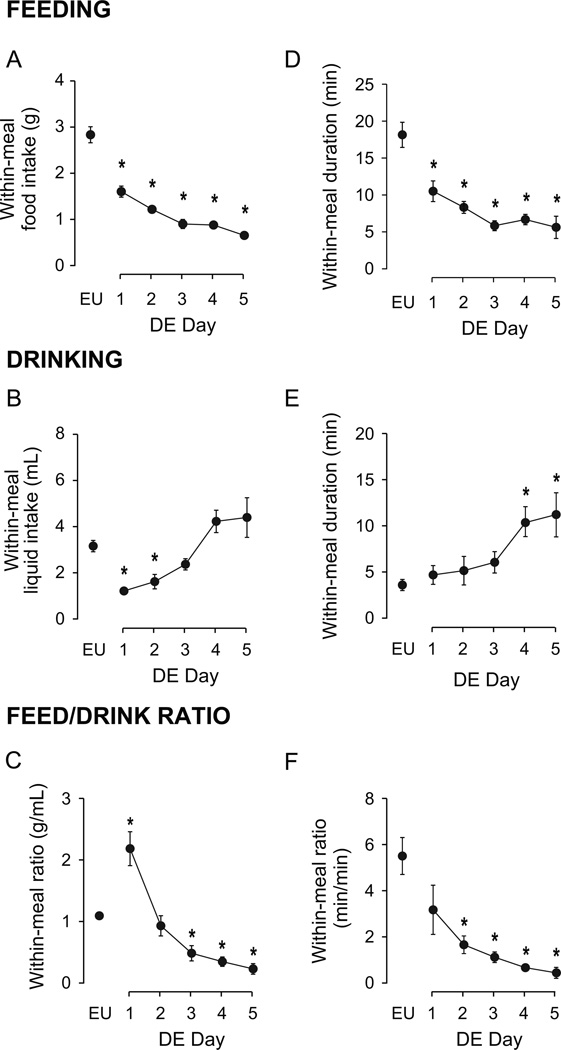
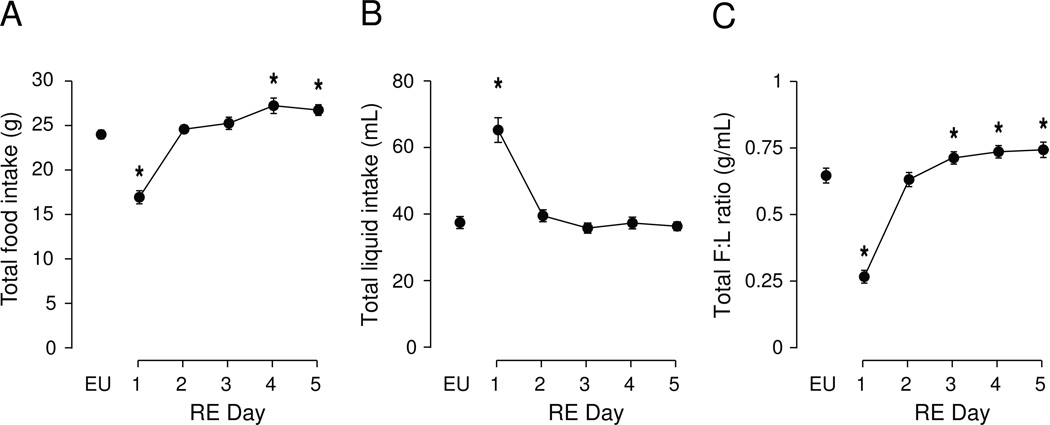
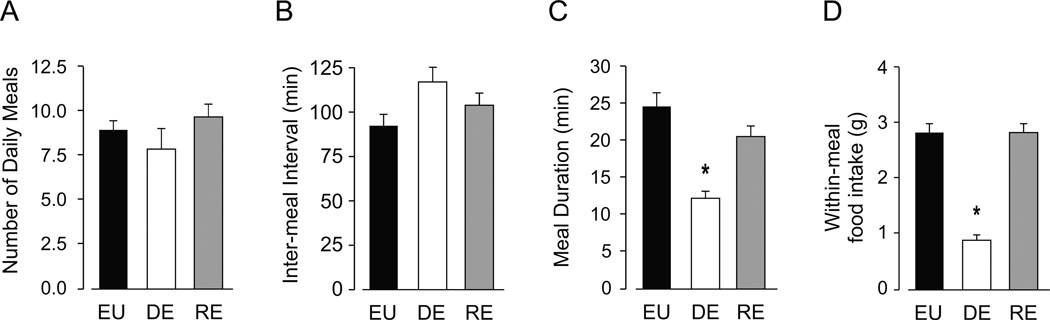
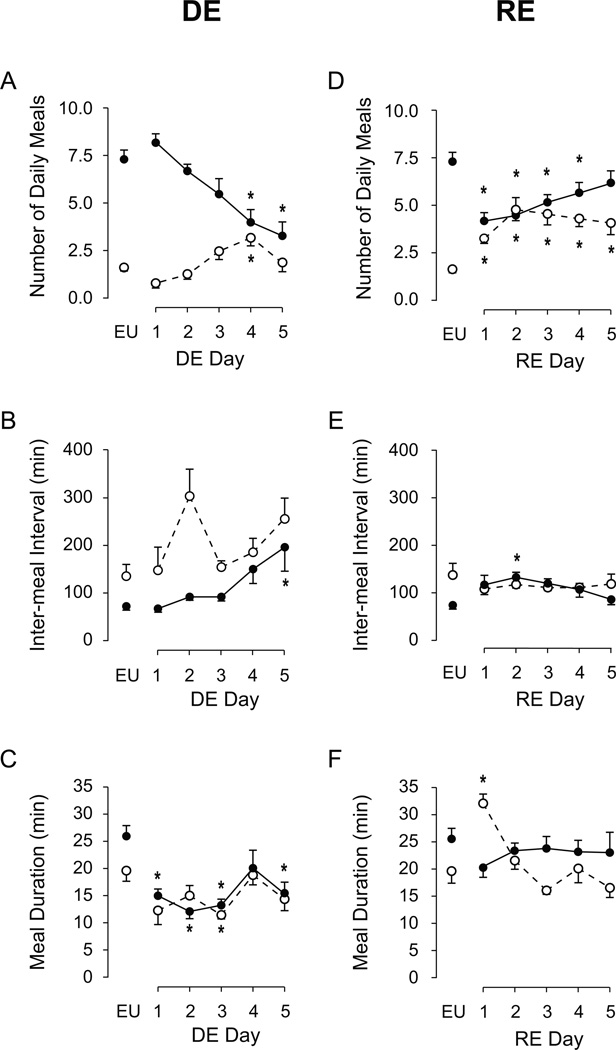
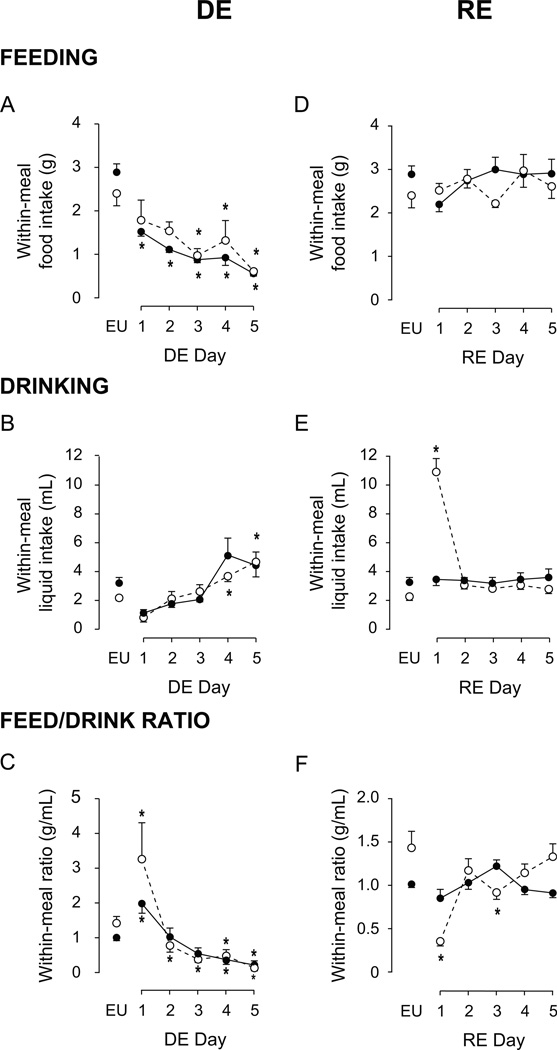
The anorexia that results from extended periods of cellular dehydration is an important physiological adaptation that limits the intake of osmolytes from food and helps maintain the integrity of fluid compartments. The ability to experimentally control both the development and reversal of anorexia, together with the understanding of underlying hormonal and neuropeptidergic signals, makes dehydration (DE)-anorexia a powerful model for exploring the interactions of neural networks that stimulate and inhibit food intake. However, it is not known which meal parameters are affected by cellular dehydration to generate anorexia. Here we use continuous and high temporal resolution recording of food and fluid intake, together with a drinking-explicit method of meal pattern analysis to explore which meal parameters are modified during DE-anorexia. We find that the most important factor responsible for DE-anorexia is the failure to maintain feeding behavior once a meal has started, rather than the ability to initiate a meal, which remains virtually intact. This outcome is consistent with increased sensitivity to satiation signals and post-prandial satiety mechanisms. We also find that DE-anorexia significantly disrupts the temporal distribution of meals across the day so that the number of nocturnal meals gradually decreases while diurnal meal number increases. Surprisingly, once DE-anorexia is reversed this temporal redistribution is maintained for at least 4 days after normal food intake has resumed, which may allow increased daily food intake even after normal satiety mechanisms are reinstated. Therefore, DE-anorexia apparently develops from a selective targeting of those neural networks that control meal termination, whereas meal initiation mechanisms remain viable.


Figures

Figure 1
Figure 1. Anatomy of the Composite Meal
Representative eating and drinking data from one EU rat that have been segmented into composite meals by the drinking-explicit method. Black vertical bars depict drinking clusters, white depict feeding bouts, dark gray depict feeding clusters, and light gray depict composite meals. Individual bar widths and horizontal lines (with and without arrows) represent duration (s). Individual bar heights and vertical lines represent within-meal food (white) or liquid (black) intake in g or mL; when a meal contains 2 or more clusters of feeding or drinking (as shown here in each meal for drinking), total within-meal intake or duration is equal to the sum of the individual clusters. Feeding bouts were assigned to clusters using meal criteria of 0.23 g minimum size, and a minimum IMI of 300 s. The same meal criteria were also used to combine feeding and drinking clusters. *Although the resolution of the BioDAQ Liquid Intake Monitor does not capture drinking microstructure, drinking clusters also consist of smaller bouts, similar to those comprising feeding clusters.
Figure 2
Figure 2. Effects of DE progression on composite meal patterns
Mean (± SEM) composite meal duration (A), IMI (B), total number of composite meals (C), and percentage of total daily meals initiated during the nocturnal phase (D), as measured daily over the course of five days of drinking hypertonic saline (DE). The values from euhydrated control animals (EU) are the baseline values shown in Table 1. Water was replaced with 2.5% saline at 1000 hours on Day 1, and remained the only fluid available for the next five days. Significant differences across days were determined using one-way ANOVA (see text for results). Symbols denote significant individual differences between EU and subsequent days of DE, where *P<0.05.
Figure 3
Figure 3. Effects of DE progression on within-meal characteristics
Mean (± SEM) within-meal food intake (A), within-meal liquid intake (B), within-meal food:liquid intake ratio (C), within-meal feeding duration (D), within-meal drinking duration (E), within-meal feeding:drinking duration ratio (F), as measured daily over the course of five days of DE. Water was replaced with 2.5% saline at 1000 hours on Day 1, and remained the only fluid available for the subsequent five days. EU represents baseline values as shown in Table 1. Significant differences across days were determined using one-way ANOVA, see text for results; Symbols denote significant individual differences between EU and subsequent days of DE, where *P<0.05.
Figure 4
Figure 4. Effects of DE progression on total daily intake of food, hypertonic saline, and food:saline intake ratio
Mean (± SEM) total daily food intake (A), saline intake (B), and the food:saline intake ratio (C) as measured daily over the course of five days of DE. Water was replaced with 2.5% saline at 10.00h on Day 1, and remained the only fluid available for the subsequent five days. EU represents baseline values as shown in Table 1. Significant differences across days were determined using one-way ANOVA, see text for results; Symbols denote significant individual differences between EU and subsequent days of RE, where *P<0.05.
Figure 5
Figure 5. Total daily intake of food, water, and food:water intake ratio during the five days following water-back
Mean (± SEM) total daily food intake (A), water intake (B), and the food:water intake ratio (C) as measured daily for five days following the return of water to DE rats at 12.00h on Day 1. EU represents baseline values as shown in Table 1. Significant differences across days were determined using one-way ANOVA (see text for results). Symbols denote significant individual differences between EU and subsequent days of RE, where *P<0.05.
Figure 6
Figure 6. Summary of the effects of DE and RE on composite meal structure
The comparison of baseline EU data (black bars), and data collected on the third day of the DE phase (white bars) and the fourth day of the RE phase (gray bars), demonstrates the effects of DE-anorexia and the return of water on daily meal number (A), duration of the IMI (B), duration of a composite meal (C), and amount of food consumed within a meal (D). Symbols denote significant differences from EU values, where *P<0.05; see sections 3.2 and 3.3 for detailed results.
Figure 7
Figure 7. Diurnal variations of composite meal patterns during DE and RE
Effects of the daily progression of DE (A–C) and RE (D–F) on mean (± SEM) number of meals (A, D), IMI (B, E), and composite meal duration (C, F), during the dark phase (closed circles, solid lines) and light phase (open circles, dashed lines). In each graph, EU represents baseline values as shown in Table 1; Day 1 indicates the first morning of water replacement with HS for DE, or return of water for RE. Significant differences across days, for each phase, were determined using one-way ANOVA (see text for results). Symbols denoting individual differences from EU phase baseline, where *P<0.05.
Figure 8
Figure 8. Diurnal variations of within-meal food and liquid intake during DE and RE
Effects of the daily progression of DE (A–C) and RE (D–F) on mean (± SEM) within-meal food intake (A, D), within-meal liquid intake (B, E), and the food:liquid intake ratio (C, F), during the dark phase (closed circles, solid lines) and light phase (open circles, dashed lines). In each graph, EU represents baseline values as shown in Table 1; Day 1 indicates the first morning of water replacement with hypertonic saline for DE, or return of water for RE. Significant differences across days, for each phase, were determined using one-way ANOVA, see text for results; symbols denoting individual differences from EU phase baseline, where *P<0.05

References

    1. Watts AG, Boyle CN. The functional architecture of dehydration-anorexia. Physiol Behav. 2010;100:472–477. - PMC - PubMed
    1. Watts AG. Dehydration-associated anorexia: development and rapid reversal. Physiol Behav. 1999;65:871–878. - PubMed
    1. Watts AG, Sanchez-Watts G, Kelly AB. Distinct patterns of neuropeptide gene expression in the lateral hypothalamic area and arcuate nucleus are associated with dehydration-induced anorexia. J Neurosci. 1999;19:6111–6121. - PMC - PubMed
    1. Watts AG, Sanchez-Watts G. Rapid and preferential activation of Fos protein in hypocretin/orexin neurons following the reversal of dehydration-anorexia. J Comp Neurol. 2007;502:768–782. - PubMed
    1. Kissileff HR. Ingestive behavior microstructure, basic mechanisms and clinical applications. Neurosci Biobehav Rev. 2000;24:171–172. - PubMed

Publication types