Review
. 2011:193:17-38.
doi: 10.1016/B978-0-444-53839-0.00002-8.

Electrophysiological correlates of sleep homeostasis in freely behaving rats

Affiliations
Review

Electrophysiological correlates of sleep homeostasis in freely behaving rats

Vladyslav V Vyazovskiy et al. Prog Brain Res. 2011.

Abstract

The electrical activity of the brain does not only reflect the current level of arousal, ongoing behavior, or involvement in a specific task but is also influenced by what kind of activity, and how much sleep and waking occurred before. The best marker of sleep-wake history is the electroencephalogram (EEG) spectral power in slow frequencies (slow-wave activity, 0.5-4 Hz, SWA) during sleep, which is high after extended wakefulness and low after consolidated sleep. While sleep homeostasis has been well characterized in various species and experimental paradigms, the specific mechanisms underlying homeostatic changes in brain activity or their functional significance remain poorly understood. However, several recent studies in humans, rats, and computer simulations shed light on the cortical mechanisms underlying sleep regulation. First, it was found that the homeostatic changes in SWA can be fully accounted for by the variations in amplitude and slope of EEG slow waves, which are in turn determined by the efficacy of corticocortical connectivity. Specifically, the slopes of sleep slow waves were steeper in early sleep compared to late sleep. Second, the slope of cortical evoked potentials, which is an established marker of synaptic strength, was steeper after waking, and decreased after sleep. Further, cortical long-term potentiation (LTP) was partially occluded if it was induced after a period of waking, but it could again be fully expressed after sleep. Finally, multiunit activity recordings during sleep revealed that cortical neurons fired more synchronously after waking, and less so after a period of consolidated sleep. The decline of all these electrophysiological measures-the slopes of slow waves and evoked potentials and neuronal synchrony-during sleep correlated with the decline of the traditional marker of sleep homeostasis, EEG SWA. Taken together, these data suggest that homeostatic changes in sleep EEG are the result of altered neuronal firing and synchrony, which in turn arise from changes in functional neuronal connectivity.


Figures

Figure 1
Figure 1. Sleep architecture and vigilance specific cortical activity
(A) EEG slow-wave activity (SWA, EEG power between 0.5–4 Hz) and corresponding hypnogram during an undisturbed 24-h baseline in one individual rat. Vertical bars depict consecutive 4-s values of SWA. Note that SWA decreases during the 12-h light period and increases after long consolidated waking episodes. (B) From top to bottom: Surface electroencephalogram (EEG) traces from the right barrel cortex during waking, NREM sleep and REM sleep in a representative rat. Raw multiunit activity (MUA) recorded simultaneously in the same rat from a microwire array placed in the left barrel cortex (6 individual channels are shown). Note high frequency tonic firing in waking and REM sleep, and the periods of population neuronal activity and silence in NREM sleep.
Figure 2
Figure 2. Homeostatic regulation of SWA and slow wave parameters
(A) Time course of SWA in NREM sleep during the light period. Mean values (n=15 rats, SEM) are plotted for consecutive 3-h intervals. (B) Time course of EEG power spectra in NREM sleep during the light period (same data as in (A). Mean spectra are plotted for consecutive 3-h intervals. Note a progressive shift of the spectral peak towards slower frequencies in the course of the light period. (C) Distribution of the amplitude of slow waves during early and late sleep. Mean values (SEM, n = 15 rats) are plotted as percentage of the total number of waves. Triangles: amplitude ranges where slow wave incidence was higher during early sleep (triangles up) or higher during late sleep (triangles down, p<0.05, Sidak test). (D) Slopes of the 1st and 2nd segment of EEG slow waves in early sleep and late sleep. Mean values, n=15 rats. Asterisk: p<0.05, paired t-test. (E) Near-simultaneously occurring LFP slow waves recorded from layer V of the frontal and parietal cortical areas. Note that the parietal slow wave is delayed relative to the frontal wave. Dotted lines depict slopes of the slow waves. (F) Relationship between the delay between slow waves occurring in the frontal and in the parietal derivation and the corresponding slow wave slopes. One individual rat is shown. Note that slow waves have steepest slopes when they occur synchronously in the two derivations, especially in early sleep.
Figure 3
Figure 3. Sleep-wake history affects the late component of transcallosal evoked response
(A) Individual representative evoked responses after stimulation at low and high intensity. (B) Representative individual transcallosal evoked LFP response and the corresponding neuronal activity (raster below the LFP trace, each bar is a spike). Note that all neurons remain silent for about 100 ms after the stimulus (arrow), during the positive LFP wave (boxed). C. Left: Average late component of the evoked response before and after a 4-h period of waking. Mean values (n=15 rats). Triangle depicts significant difference (paired t-test). Right: Slopes of the late component before and after 4 hours of waking. Values are mean + SEM (n=15) expressed as % of the “before” condition (=100%). D. Left: Average late component of the evoked response before and after a 4-h period of consolidated sleep. Mean values (n=24 rats). Triangles depict significant differences (paired t-test). Right: Slopes of the late component before and after 4 hours of sleep. Values are mean + SEM (n=24) expressed as % of the “before” condition (=100%).
Figure 4
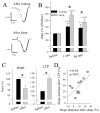
Figure 4. LTP is partially occluded after waking
(A) Representative average evoked LFPs from the right frontal cortex induced by transcallosal stimulation of the left frontal cortex in a quietly awake rat before (black) and after (grey) LTP induction. Note a minor change in the response when LTP induction was attempted after waking (top), and a substantial increase when LTP was induced after a period of sleep (bottom). (B) Slopes of evoked potentials immediately before and after LTP induction (1 min, 50 min) attempted following a period of waking or sleep. Values are mean ± SEM (n=10) expressed as % of the corresponding “before” condition (=100%). (C) Left: Slopes of evoked LFPs before and after a consolidated 4-h period of sleep. Right: Slopes of evoked LFPs before and after LTP induction (mean values, SEM, n=10). Asterisks: p < 0.05; two-tailed paired t-test. (D) Relationship between the decrease in LFP slope after sleep and the following increase after LTP, shown in (C). Each circle is an individual rat (n=10).
Figure 5
Figure 5. Sleep-wake history affects cortical neuronal firing patterns
(A) 4-s frontal LFP records in early and late NREM sleep. Corresponding raster plots of spike activity (10 units are shown, each vertical line is a spike) are shown below the LFP traces. Note the close temporal relationship between silent (OFF) periods and the positive phases of LFP slow waves in NREM sleep. (B) Mean values (n = 6 rats) of incidence and duration of the ON and OFF periods shown for consecutive 3-h intervals during the light period expressed as percentage of the corresponding mean 12-h value. (C) Representative examples of a high-amplitude slow EEG wave with steep slopes typical of early sleep (left) and low-amplitude slow wave typical of late sleep (right), and the corresponding OFF periods (raster plots, each bar is a spike). Note that neurons are more synchronous at the ON-OFF and OFF-ON transitions during the high-amplitude slow wave. (D) Mean slopes of slow waves corresponding to synchronous ON-OFF transition (high: top 50%) and asynchronous ON-OFF transitions (low: bottom 50%). Neuronal synchrony was computed as the average latency between the last spikes of individual neurons to the onset of the population OFF period. Note that high neuronal synchrony is associated with steeper slow wave slopes (triangle, p<0.01). Mean values, n=6 rats.
Figure 6
Figure 6. Waking activities result in a homeostatic increase in NREM sleep SWA
Waking activity is associated with learning/plasticity that lead to increased cortical net synaptic strength. More efficient neuronal connectivity results in more efficient neuronal synchronization, which is manifested in faster rates of decruitment and recruitment of neurons into the slow oscillation in NREM sleep. The occurrence of frequent prolonged periods of neuronal population silence is manifested in the EEG signal as frequent incidence of high amplitude slow waves with steep slopes. High amplitude slow waves in turn account for high spectral power in SWA band.

Similar articles

Cited by

References

    1. Abraham WC, Bliss TV, Goddard GV. Heterosynaptic changes accompany long-term but not short-term potentiation of the perforant path in the anaesthetized rat. J Physiol. 1985;363:335–349. - PMC - PubMed
    1. Achermann P, Borbely AA. Low-frequency (< 1 Hz) oscillations in the human sleep electroencephalogram. Neuroscience. 1997;81:213–222. - PubMed
    1. Achermann P, Borbely AA. Temporal evolution of coherence and power in the human sleep electroencephalogram. J Sleep Res. 1998;7(Suppl 1):36–41. - PubMed
    1. Aizenman CD, Kirkwood A, Bear MF. A current source density analysis of evoked responses in slices of adult rat visual cortex: implications for the regulation of long-term potentiation. Cereb Cortex. 1996;6:751–758. - PubMed
    1. Alger BE, Teyler TJ. Long-term and short-term plasticity in the CA1, CA3, and dentate regions of the rat hippocampal slice. Brain Res. 1976;110:463–480. - PubMed

Publication types

LinkOut - more resources