

Temporal dynamics of cortical sources underlying spontaneous and peripherally evoked slow waves
- PMID: 21854964
- PMCID: PMC3160723
- DOI: 10.1016/B978-0-444-53839-0.00013-2
Temporal dynamics of cortical sources underlying spontaneous and peripherally evoked slow waves
Abstract
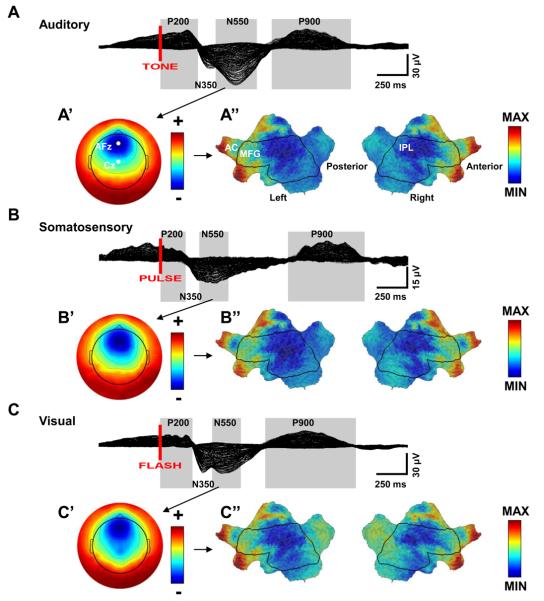
Slow waves are the most prominent electroencephalographic feature of non-rapid eye movement (NREM) sleep. During NREM sleep, cortical neurons oscillate approximately once every second between a depolarized upstate, when cortical neurons are actively firing, and a hyperpolarized downstate, when cortical neurons are virtually silent (Destexhe et al., 1999; Steriade et al., 1993a, 2001). Intracellular recordings indicate that the origins of the slow oscillation are cortical and that corticocortical connections are necessary for their synchronization (Amzica and Steriade, 1995; Steriade et al., 1993b; Timofeev and Steriade, 1996; Timofeev et al., 2000). The currents produced by the near-synchronous slow oscillation of large populations of neurons appear on the scalp as electroencephalogram (EEG) slow waves (Amzica and Steriade, 1997). Despite this cellular understanding, questions remain about the role of specific cortical structures in individual slow waves. Early EEG studies of slow waves in humans were limited by the small number of derivations employed and by the difficulty of relating scalp potentials to underlying brain activity (Brazier, 1949; Roth et al., 1956). Functional neuroimaging methods offer exceptional spatial resolution, but lack the temporal resolution to track individual slow waves (Dang-Vu et al., 2008; Maquet, 2000). Intracranial recordings in patient populations are limited by the availability of medically necessary electrode placements and can be confounded by pathology and medications (Cash et al., 2009; Nir et al., 2011; Wenneberg 2010). Source modeling of high-density EEG recordings offers a unique opportunity for neuroimaging sleep slow waves. So far, the results have challenged several of the influential topographic observations about slow waves that had persisted since the original EEG recordings of sleep. These recent analyses revealed that individual slow waves are idiosyncratic cortical events and that the negative peak of the EEG slow wave often involves cortical structures not necessarily apparent from the scalp, like the inferior frontal gyrus, anterior cingulate, posterior cingulate, and precuneus (Murphy et al., 2009). In addition, not only do slow waves travel (Massimini et al., 2004), but they often do so preferentially through the areas comprising the major connectional backbone of the human cortex (Hagmann et al., 2008). In this chapter, we will review the cellular, intracranial recording, and neuroimaging results concerning EEG slow waves. We will also confront a long held belief about peripherally evoked slow waves, also known as K-complexes, namely that they are modality independent and do not involve cortical sensory pathways. The analysis included here is the first to directly compare K-complexes evoked with three different stimulation modalities within the same subject on the same night using high-density EEG.
Copyright © 2011 Elsevier B.V. All rights reserved.
Figures
Comment in
-
Slow brain oscillations of sleep, resting state, and vigilance.Prog Brain Res. 2011;193:3-15. doi: 10.1016/B978-0-444-53839-0.00001-6. Prog Brain Res. 2011. PMID: 21854952
References
-
- Amzica F, Steriade M. The K-complex: its slow (<1-Hz) rhythmicity and relation to delta waves. Neurology. 1997;49:952–959. - PubMed
-
- Amzica F, Steriade M. Cellular substrates and laminar profile of sleep K-complex. Neuroscience. 1998a;82:671–686. - PubMed
-
- Amzica F, Steriade M. Electrophysiological correlates of sleep delta waves. Electroencephalogr Clin Neurophysiol. 1998b;107:69–83. - PubMed
-
- Bastien CH, Crowley KE, Colrain IM. Evoked potential components unique to non-REM sleep: relationship to evoked K-complexes and vertex sharp waves. Int J Psychophysiol. 2002;46:257–274. - PubMed
Publication types
MeSH terms
Grants and funding
LinkOut - more resources
Full Text Sources
Other Literature Sources
Miscellaneous
