. 2011 Aug 19;146(4):533-43.
doi: 10.1016/j.cell.2011.07.034.

Linking RNA polymerase backtracking to genome instability in E. coli

Affiliations

Linking RNA polymerase backtracking to genome instability in E. coli

Dipak Dutta et al. Cell. .

Abstract

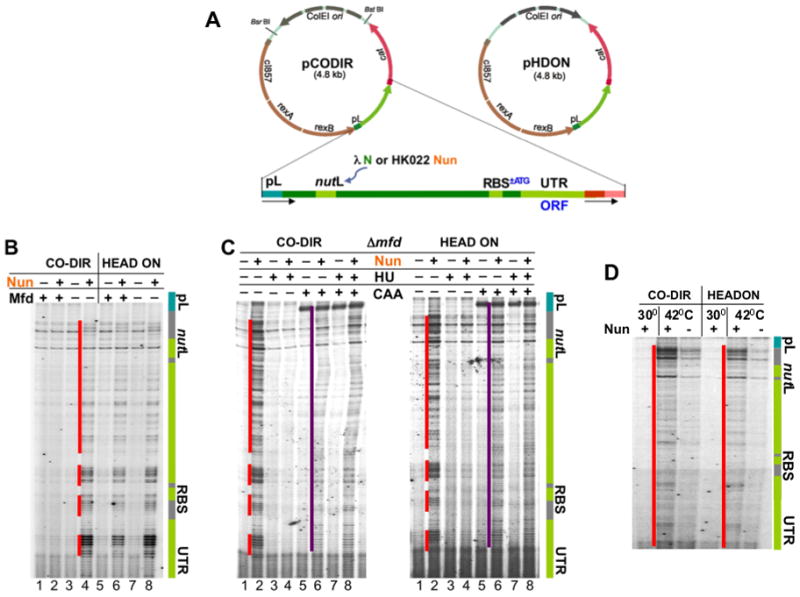
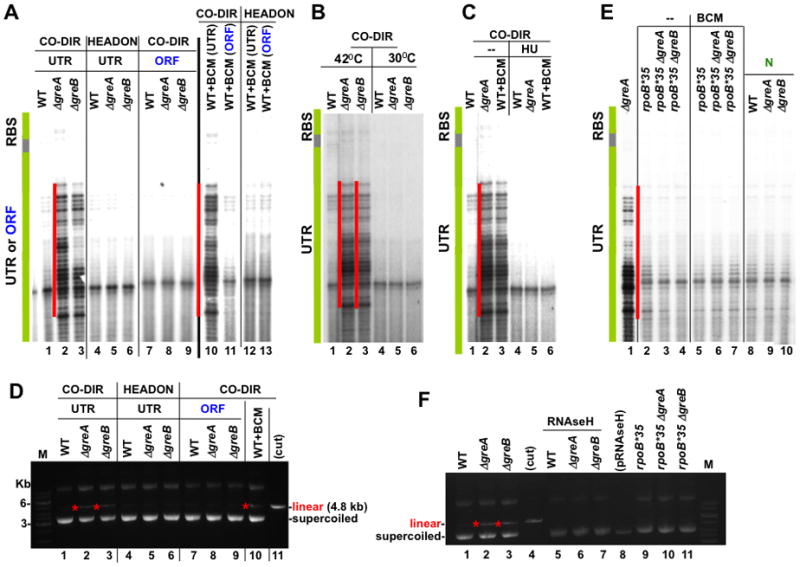
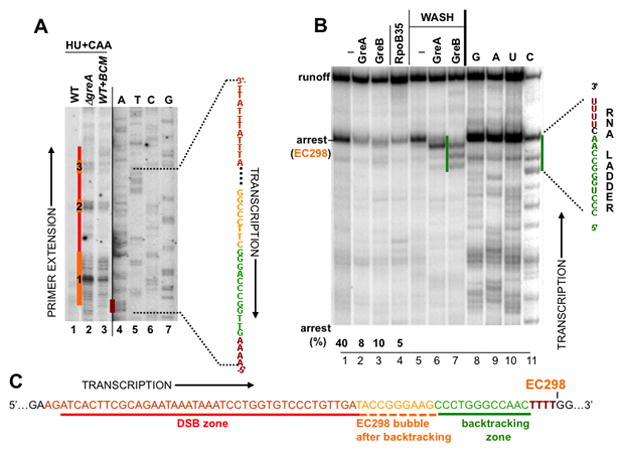
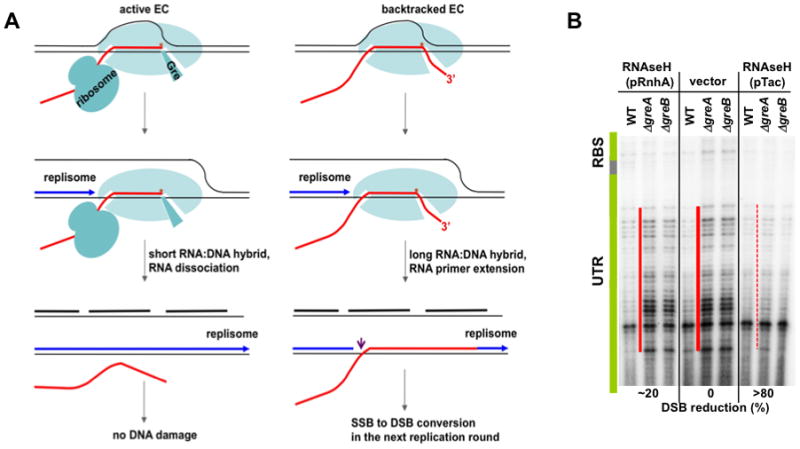
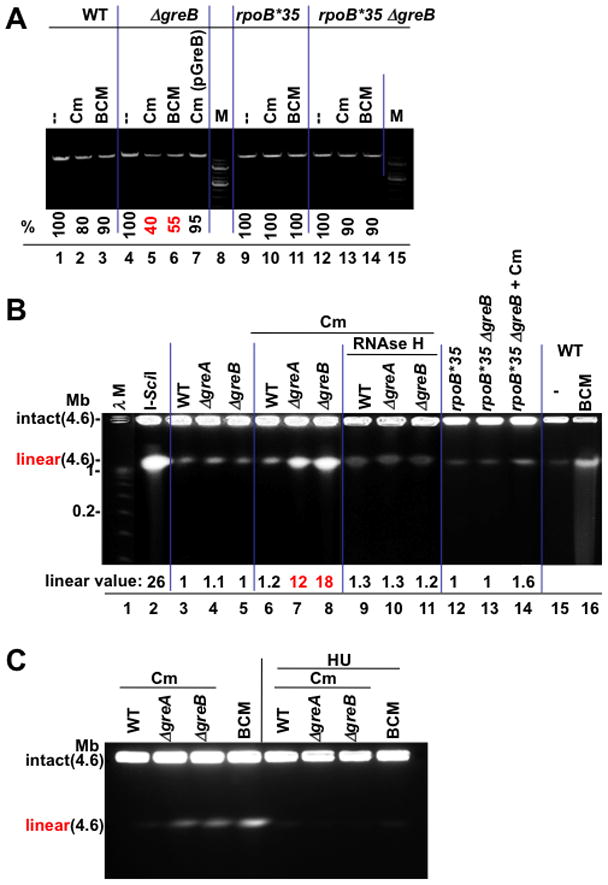
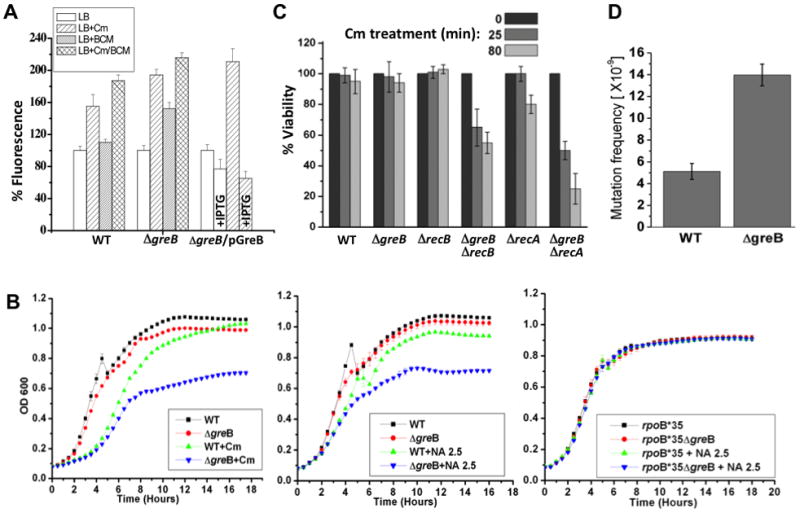
Frequent codirectional collisions between the replisome and RNA polymerase (RNAP) are inevitable because the rate of replication is much faster than that of transcription. Here we show that, in E. coli, the outcome of such collisions depends on the productive state of transcription elongation complexes (ECs). Codirectional collisions with backtracked (arrested) ECs lead to DNA double-strand breaks (DSBs), whereas head-on collisions do not. A mechanistic model is proposed to explain backtracking-mediated DSBs. We further show that bacteria employ various strategies to avoid replisome collisions with backtracked RNAP, the most general of which is translation that prevents RNAP backtracking. If translation is abrogated, DSBs are suppressed by elongation factors that either prevent backtracking or reactivate backtracked ECs. Finally, termination factors also contribute to genomic stability by removing arrested ECs. Our results establish RNAP backtracking as the intrinsic hazard to chromosomal integrity and implicate active ribosomes and other anti-backtracking mechanisms in genome maintenance.


Figures

Figure 1
Figure 1. Collisions between replication and permanently arrested ECs lead to DNA damage in vivo
(A) Plasmids pCODIR and pHDON used to monitor co-directional and head-on collisions between the replisome and RNAP. The gray arrow indicates the direction of replication. The phage λ cassette containing the pL promoter and N utilization site (nutL) is shown in green. NutL is also used to recruit Nun. The downstream part of the cassette can be converted to ORF upon insertion of ATG linked to preexisting RBS. ColE1 replication is similar to that of E. coli chromosome. Although Pol I synthesizes the first ~400 nt of the leading strand during the early phase of ColE1 replication, the remainder of the plasmid is replicated by the pol III replisome, as is the E. coli chromosome (del Solar et al., 1998). Thus the DNA polymerase that collides with arrested ECs is pol III, mimicking the natural replication of the chromosome. (B) Nun-arrested ECs cause DNA breaks, which are prevented by Mfd in instances of co-directional but not in head-on transcription and replication. Sequencing gels demonstrate primer extension analyses of the nontemplate strand in pCODIR (lanes 1–4) and pHDON (lanes 5–8). Where indicated (+) Nun and/or Mfd were expressed. The green bar shows the elements of the λ cassette. Red lines show the positions of DNA lesions. See also Supplemental Figure S2. (C) Nun-mediated DNA breaks depend on replication. Where indicated (+), the replication inhibitor HU and/or the single strand DNA probe CAA was added. The purple line shows CAA modifications of the nontemplate strand corresponding to queuing transcription bubbles of initiation and elongation complexes. (D) Nun-mediated DNA breaks depend on transcription. Where indicated cells were shifted to 42°C to induce transcription from pL promoter. Red lines show the positions of DNA lesions.
Figure 2
Figure 2. Anti-backtracking factors eliminate DNA damage associated with co-directional collisions of the replisome with naturally arrested ECs
(A) Active ribosomes, GreA, GreB, and Rho protect against DNA breaks. Panels demonstrate primer extension analyses of the non-template strand of pCODIR (lanes 1–3 and 7–11) and pHDON (lanes 4–6 and 12, 13). UTR and ORF specify conditions when translation was prohibited or allowed, respectively, from RBSN. The green bar shows the location of RBSN. The red lines show the positions of major DNA lesions, which appear co-directionally only in the absence of translation and without GreA or GreB (lanes 2 and 3). The same lesions also appear when Rho termination was inhibited by BCM in the absence of translation (lane 10). See also Supplemental Figure S2. (B) DSBs depend on transcription. Primer extension analysis of the pCODIR plasmids isolated from wild type, ΔgreA and ΔgreB strains shows that DNA lesions do not appear at 30°C, i.e. without pL promoter activation. (C) DSBs are the result of co-directional collisions between the replisome and naturally arrested ECs. HU inhibition of replication eliminates DSBs (compare lanes 2–4 with 5–7). (D) The agarose gel analysis of the plasmids used in (A). Red stars indicate linearized species that appear in the absence of translation and without GreA or GreB (lanes 2 and 3) and also when Rho termination was inhibited by BCM in the absence of translation (lane 10). (E) Backtracking-resistant RNAP mutant rpoB*35 (lanes 2–7) and λN (lanes 8–10) suppress DSBs within the UTR of pCODIR. See also Supplemental Figure S3. (F) rpoB*35 and RNAse H suppress plasmid linearization associated with Gre deficiency. The agarose gel shows linear and supercoiled pCODIR species. The low copy plasmid expressing RNAse H from the Tac promoter (pRNAseH) was present in pCODIR-transformed cells (lanes 5–7).
Figure 3
Figure 3. Characterization of ECs that lead to DSBs
(A) Mapping arrested ECs in vivo. HU + CAA indicates that HU-treated cells were were treated with CAA. The CAA footprint reveals the position of the transcription bubble of EC298, which was spontaneously arrested within the UTR (orange line #1; see B and C) and two other ECs arrayed behind EC298 (orange line #2 and 3). These ECs could be detected only in the absence of either of two Gre factors (lanes 2) or in the presence of BCM (lane 3) (compare to lane 1). (B) A single-round runoff assay utilizing a PCR-generated λ pL template from pCODIR. Wt (lane 1–3) and RpoB*35 (lane 4) RNAPs were immobilized on metal-chelating beads and chased in the presence or absence of GreA or GreB. The major arrest site at position +298, which was mapped by RNA sequencing, is indicated (lanes 8–11). To determine the sensitivity of EC298 to GreA and GreB and the size of their cleavage products, beads were washed after the chase reaction followed by incubation with GreA/GreB (see Experimental Procedures) (lanes 5–7). The green line shows the size of cleavage products (up to 16 nt) generated by GreB, reflecting the maximum backtracking distance (Nudler et al., 1997). (C) EC298 positioning before and after backtracking with respect to DSBs detected in vivo. Schematics show the sequence of a UTR segment encompassing major DSBs (red lines in A). The position of the transcription bubble was mapped in vivo (orange line #1 in A). It corresponds to spontaneously backtracked and arrested EC298. The four Ts from which EC298 backtracked (dark red) correspond to the dark red line in (A) (“A” sequencing on the non-template strand).
Figure 4
Figure 4. The proposed mechanism of DSB formation as a result of codirectional collisions with backtracked ECs
(A) The pink arrow indicates the single strand break (SSB) due to replisome switching from the leading DNA strand (blue) to the RNA primer (red) (Pomerantz and O’Donnell. 2008). Transcript cleavage factor (Gre) is shown bound in the secondary channel (left), through which the RNA 3′-OH end is extruded during backtracking (right). See the text for details. (B) R-loop-mediated DSBs formation. RNAse H suppresses DSBs in Gre-deficient cells in a dose-dependent manner. The conditions were as in Figure 2A, except that pCODIR-bearing cells were also transformed with a low-copy plasmid expressing RNAse H (rnhA) from its own promoter (lanes 1–3) or the Tac promoter (lanes 7–9). See also Supplemental Figure S4.
Figure 5
Figure 5. Chromosomal damage as a function of RNAP backtracking
(A) Sub-lethal amounts of the translation inhibitor chloramphenicol (Cm) and BCM produce greater chromosome damage in GreB-deficient cells. The integrity of chromosomal DNA was monitored by PCR. A representative agarose gel shows a 10 kB fragment amplified from equal amounts of genomic DNA isolated from wt (lanes 1–3), ΔgreB (lane 4–6), ΔgreB(pGreB) (lane 7), and rpoB*35 (lanes 9–11), and rpoB*35 ΔgreB (lane 12–14) cells (see Methods). M, 1 kb DNA marker. % indicates the fraction of the full-length PCR products. Values are the average numbers from three experiments with the error margin of less than 5%. (B) Pulse field gel analysis of chromosomal DSBs; lane 1: λ concatemers from 0.05–1.0 Mb; lane 2: 4.6 Mb linearized E. coli chromosomes (I-SceI); lane 3–5: DNA from wild type (WT) and Gre-deficient cells; lanes 6–8: DNA from wt and Gre-deficient cells after treatment with 4 μg/ml Cm; lanes 9–11: DNA from RNAse H expressing cells after Cm treatment; lanes 12–14: DNA from rpoB*35 and rpoB*35 Gre-deficient cells before and after Cm treatment; lane 16: BCM-treated cells. “Linear value” indicates the fold-increase in linear DNA after Cm or BCM treatment. The values are the average of two or more independent experiments. Note that due to low resolution of PFGE, the species indicated as linear may result from more than one random DSB. (C) Chromosomal DSBs depend on replication. Pulse field gel analysis of chromosomal DSBs shows that inhibition of replication by HU eliminates all DSBs in wild type and Gre-deficient cells exposed to sub-lethal doses of Cm or BCM.
Figure 6
Figure 6. Cell survival under conditions of excessive backtracking depends on error-prone DSBs repair
(A) SOS response activation by sub-lethal amounts of Cm and BCM in the presence or absence of GreB. Cm induced fluorescence in recA’::gfp (wt), and both Cm and BCM induced in recA’::gfp ΔgreB. SOS caused by Cm was suppressed by IPTG-induced overexpression of GreB (recA’::gfp ΔgreB(pGreB) cells). In each case, the basal level of fluorescence before induction was taken as 100%. Values are the mean ±SD from four experiments. (B) GreB-deficient cells are more sensitive to Cm (top) and NA (bottom). Numbers indicate the antibiotic concentrations (μg/ml). (C) Survival of RNAP backtracking-prone cells depends on the DSBs repair machinery. Exponentially grown wild type and mutant E. coli cells were challenged with Cm (100 μg/ml) for indicated time periods, washed, and then plated for overnight incubation to determine CFUs. The fraction of surviving cells (%) in relation to wild type is shown as the mean ±SD from three independent experiments. (D) Mutation frequency increases in GreB deficient cells. Wild type and mutant strains grew to OD 0.6 and then spread over LB-agar surface containing 30 μg/ml of rifampicin (rif). Plates were incubated at 30°C for 24 hours to detect RifR colonies. CFU/ml was calculated by spreading serially diluted cultures over LB-agar plates. The estimated mutation frequency is shown as the mean ±SD from three independent experiments.

References

    1. Alff-Steinberger C. Comparative study of mutations in Escherichia coli and Salmonella typhimurium shows that codon conservation is strongly correlated with codon usage. J Theor Biol. 2000;206:307–311. - PubMed
    1. Azvolinsky A, Dunaway S, Torres JZ, Bessler JB, Zakian VA. The S. cerevisiae Rrm3p DNA helicase moves with the replication fork and affects replication of all yeast chromosomes. Genes Dev. 2006;20:3104–3116. - PMC - PubMed
    1. Birren B, Lai E. Pulse Field Gel Electrophoresis, a Practical Guide. Academic Press; New York: 1993.
    1. Blattner FR, et al. The complete genome sequence of Escherichia coli K-12. Science. 1997;277:1453–1474. - PubMed
    1. Borukhov S, Lee J, Laptenko O. Bacterial transcription elongation factors: new insights into molecular mechanism of action. Mol Microbiol. 2005;55:1315–1324. - PubMed

Publication types

MeSH terms

Substances