. 2011 Aug 19;146(4):555-67.
doi: 10.1016/j.cell.2011.07.012.

The spatial arrangement of chromosomes during prometaphase facilitates spindle assembly

Affiliations

The spatial arrangement of chromosomes during prometaphase facilitates spindle assembly

Valentin Magidson et al. Cell. .

Abstract

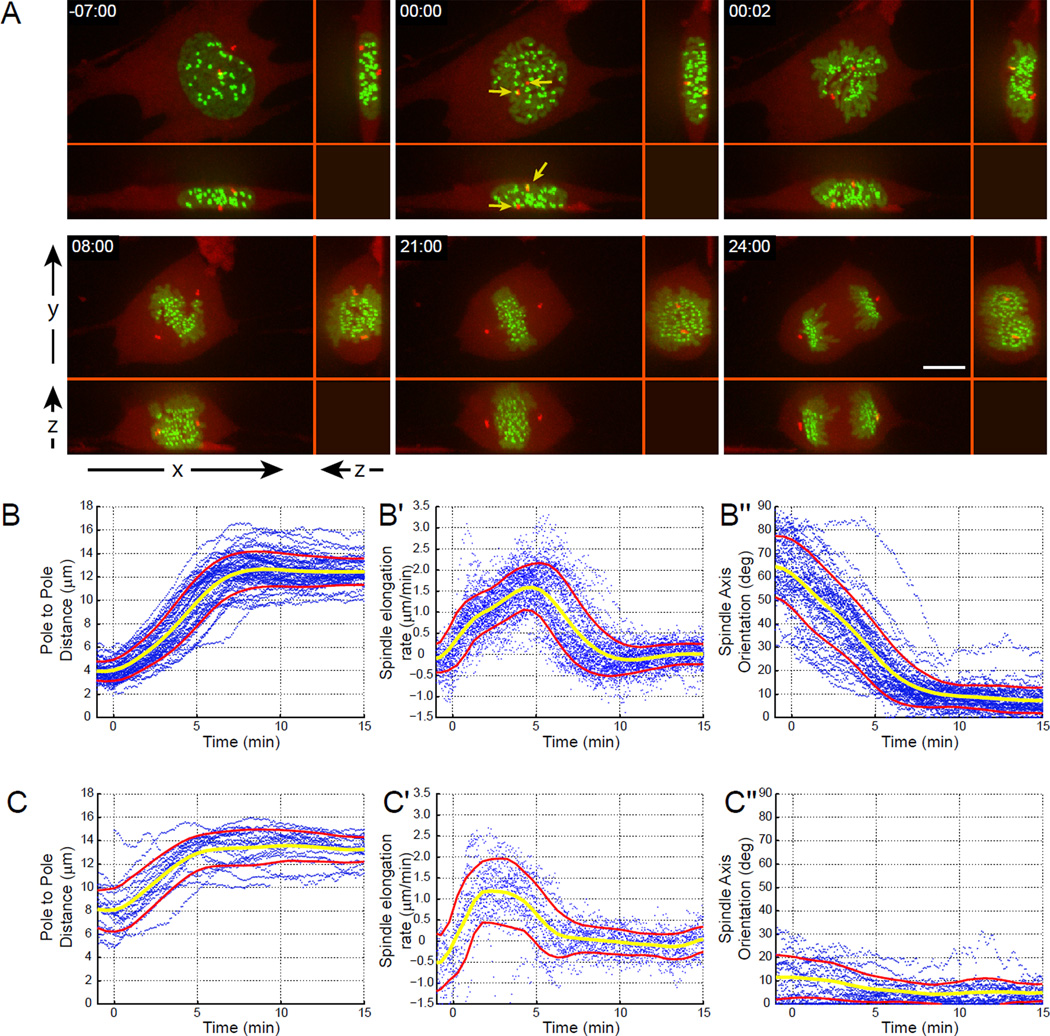
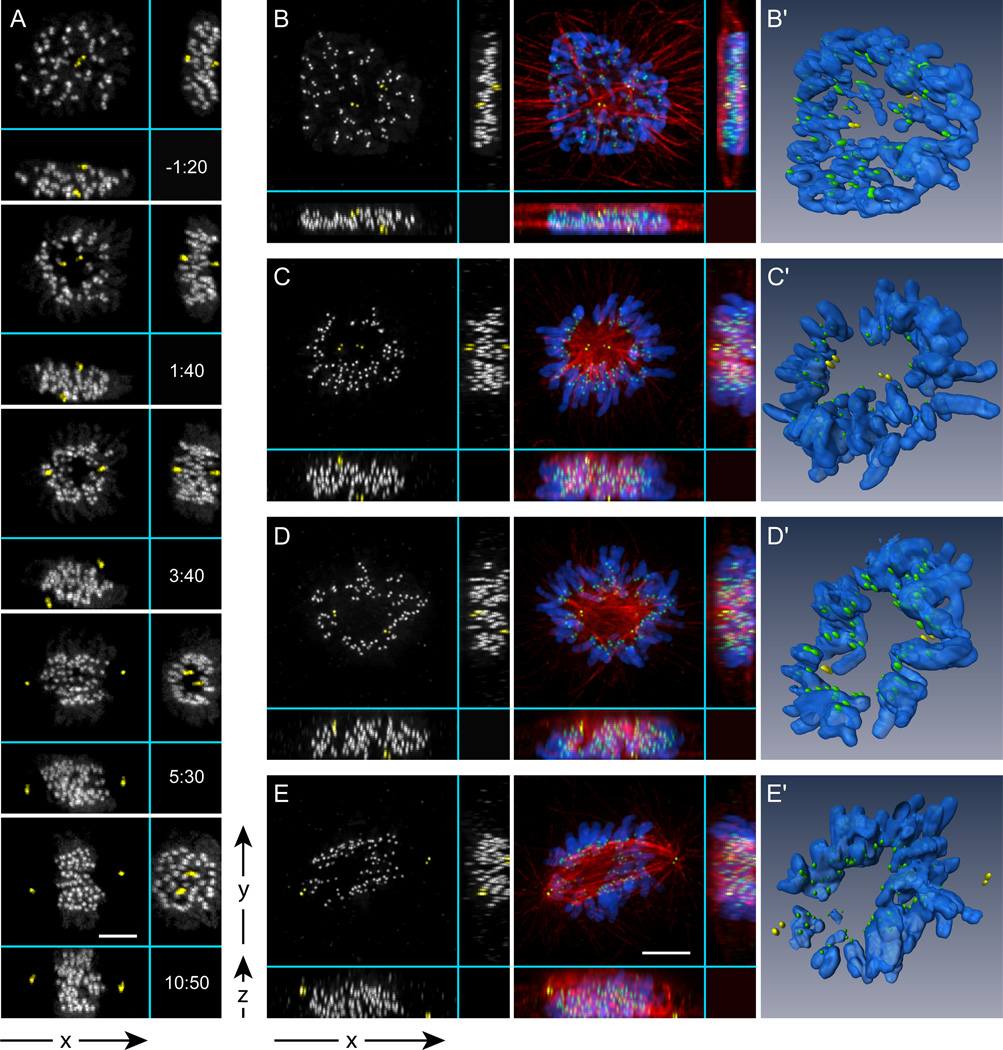
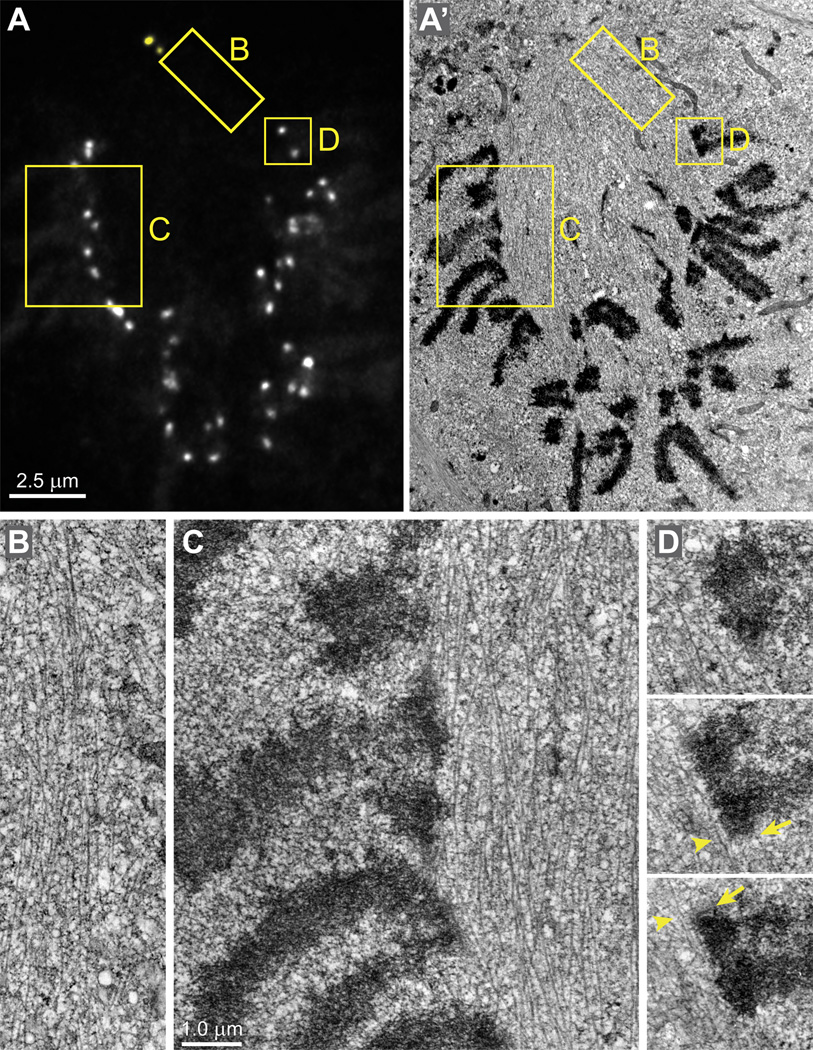
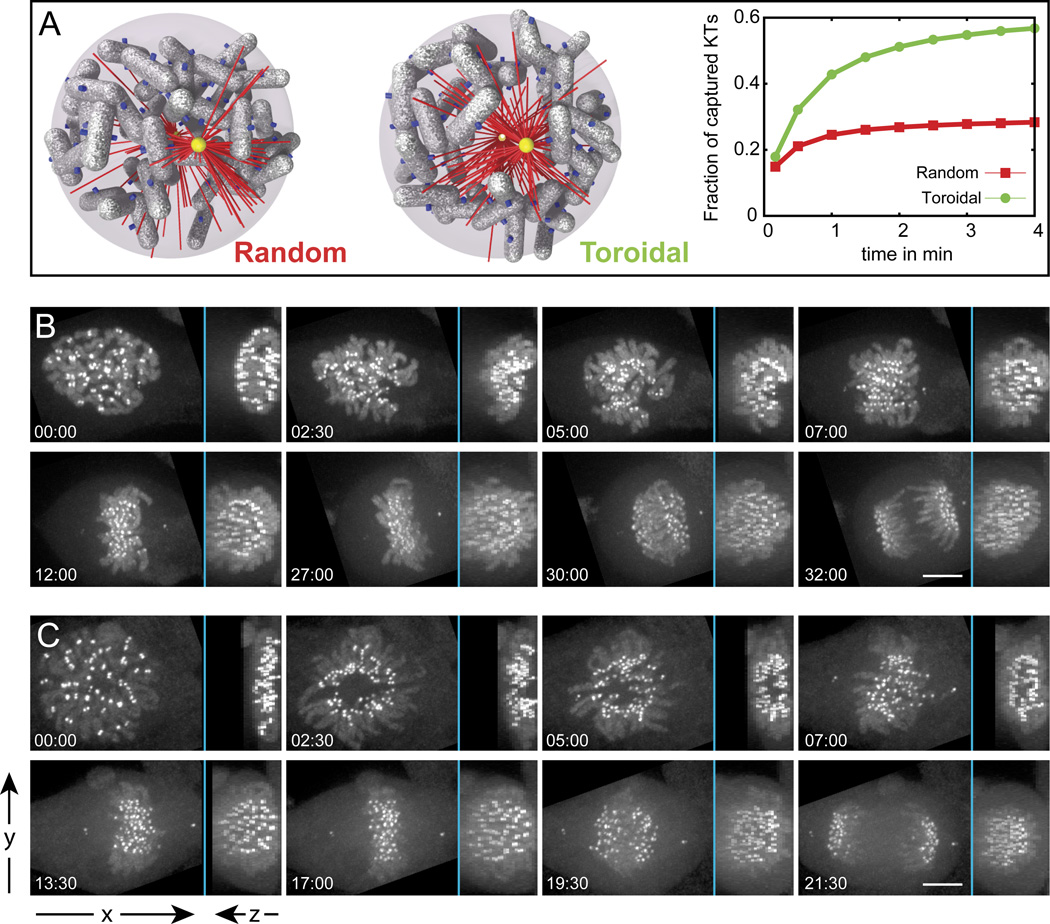
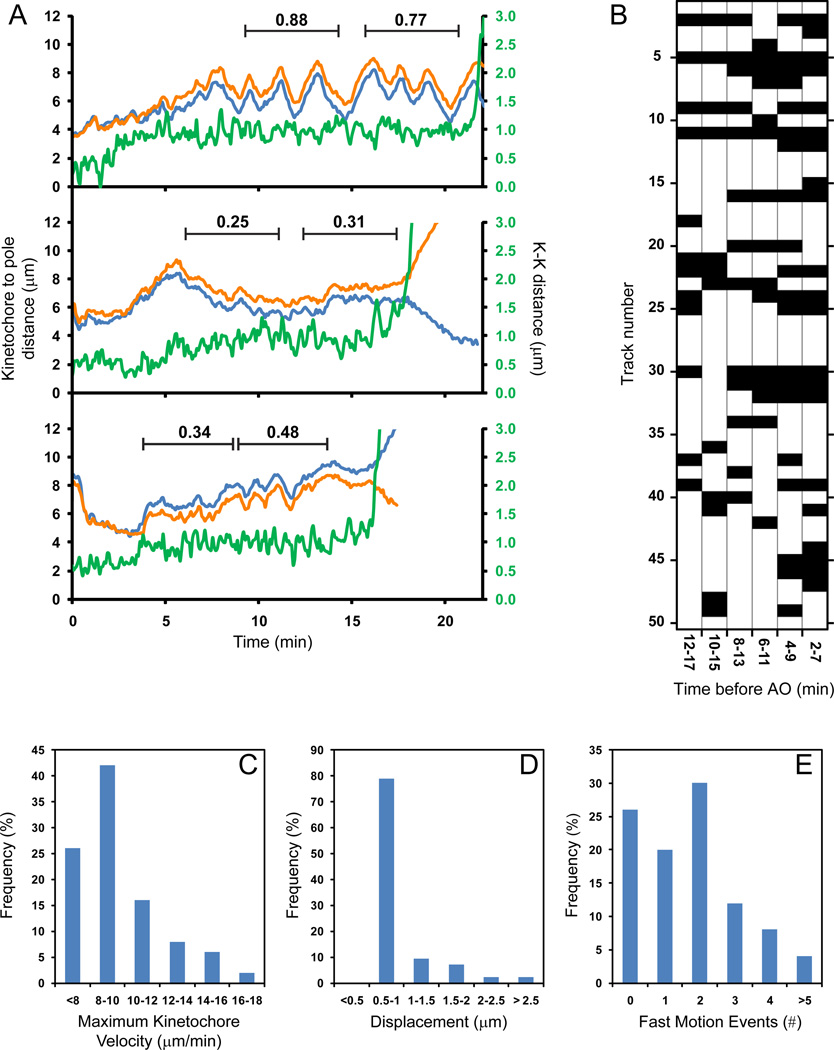
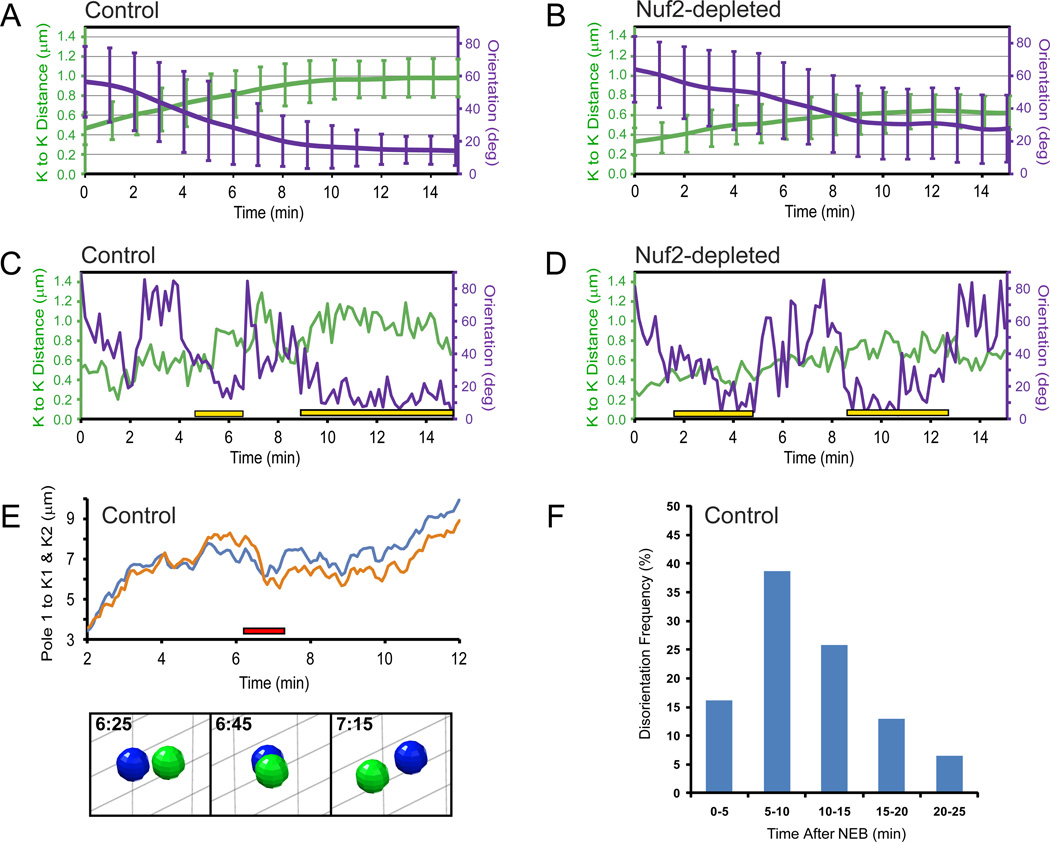
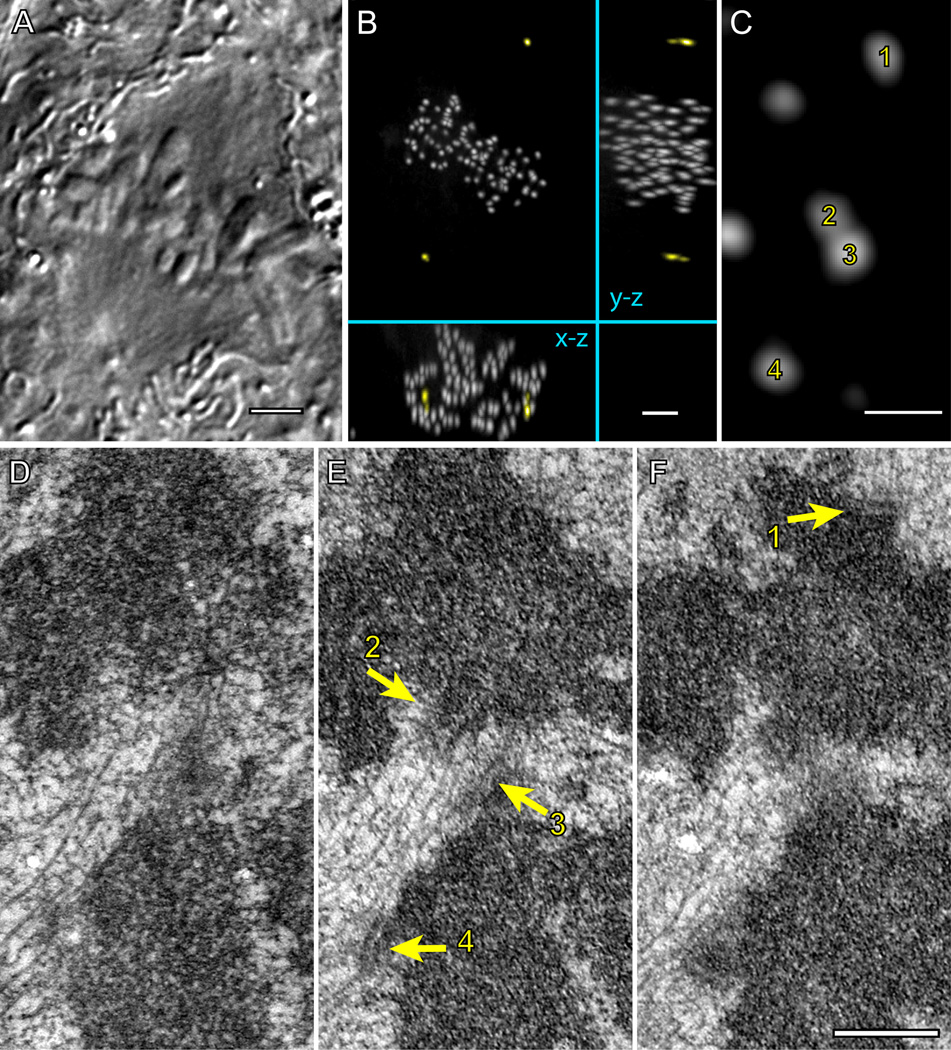
Error-free chromosome segregation requires stable attachment of sister kinetochores to the opposite spindle poles (amphitelic attachment). Exactly how amphitelic attachments are achieved during spindle assembly remains elusive. We employed photoactivatable GFP and high-resolution live-cell confocal microscopy to visualize complete 3D movements of individual kinetochores throughout mitosis in nontransformed human cells. Combined with electron microscopy, molecular perturbations, and immunofluorescence analyses, this approach reveals unexpected details of chromosome behavior. Our data demonstrate that unstable lateral interactions between kinetochores and microtubules dominate during early prometaphase. These transient interactions lead to the reproducible arrangement of chromosomes in an equatorial ring on the surface of the nascent spindle. A computational model predicts that this toroidal distribution of chromosomes exposes kinetochores to a high density of microtubules which facilitates subsequent formation of amphitelic attachments. Thus, spindle formation involves a previously overlooked stage of chromosome prepositioning which promotes formation of amphitelic attachments.


Figures

Figure 1
Figure 1. The pattern of spindle elongation and orientation in RPE1 cells
(A) An RPE1 cell expressing CENP-A-GFP (green) to label the kinetochores and centrin1-tdTomato (red) to label the centrosomes is shown. Although in XY view the centrosomes appear to reside in a common complex just before NEB (arrows in 00:00), XZ and YZ views demonstrate that the centrosomes are actually positioned on the opposite sides of the nucleus (above and below). (B–C) Numeric characterization of spindle elongation and orientation in 67 RPE1 cells co-expressing centrin-GFP and CENP-A-PAGFP. Each plot presents individual trajectories (blue dots), the average value (yellow line), and standard deviation (red lines). Spindle length (B, C), rate of spindle elongation (B’, C’), and spindle orientation (B”, C”) in V- (B–B”) vs. H-cells (C–C”). Note the remarkable reproducibility of spindle elongation and rotation pattern.
Figure 2
Figure 2. Multi-dimensional analysis of spindle assembly
(A) Selected frames from a high-resolution 4-D time-lapse movie of a cell labeled with centrin1-GFP and CENP-A-GFP. For clarity, centrioles are pseudo-colored yellow. Notice that one centrosome is positioned above and the other – below the nucleus (V-cell). In less than 2 min after NEB a clear zone, void of chromosomes, develops between the separating centrosomes (1:40). As the spindle rotates, the zone persists as evident from the YZ view (5:30). Later, the chromosomes re-populate the central part of the spindle (10:50). Time shown relative to NEB in min:sec. (B–E) Immunofluorescence images and computer generated surface renderings (B'–E') of fixed RPE1 cells during early-to-mid prometaphase. The volume between the poles that is void of chromosomes is filled with high-density of microtubules (C–D; C'–D'). Once the spindle rotates to a vertical position a typical prometaphase morphology becomes apparent in the conventional XY view (E, E’). Bars, 5 µm.
Figure 3
Figure 3. Architecture of the early-prometaphase spindle
(A–A’) A single GFP-fluorescence focal plane (A) and the corresponding EM section (A’) selected from complete 3-D datasets. Chromosomes are excluded from the spindle and the centromeres reside on the spindle surface. Insets denote the areas presented at higher magnification in (B–D). (B) A view of the sharp demarcation between the spindle and the rest of the cytoplasm showing the high density of microtubules inside the spindle and their absence in the cytoplasm. (C) The centromeres reside on the surface of the spindle. Note that only few microtubules can be found outside the spindle between the chromosome arms. (D) Serial sections through a centromere on the surface of the spindle. Both sister kinetochores (arrows) lack end-on microtubule attachments but laterally interact with individual microtubules (arrowheads) that run parallel to the centromere. The distance between sister kinetochores is ~1 µm in spite the lack of end-on attachments. See Fig.S3 for 3-D data on the kinetochore distribution in this cell. Scale bars are 2.5 µm for (A–B) and 1 µm for (B–D).
Figure 4
Figure 4. The chromosome ring facilitates spindle assembly
(A) Two types of initial chromosome distribution (Random and Toroidal) and corresponding dynamics of kinetochore capture predicted in our computer simulations. The toroidal distribution provides a clear kinetic advantage. (B–C) Mitosis in chromokinesin Kid-depleted (B) vs. control (C) cells. Depletion of Kid inhibits formation of the central clear zone. In contrast, chromosomes in control cells are excluded from the center of the spindle during early prometaphase (C; 02:30 – 07:00). Notice that to generate consistent perspective, both sequences are illustrated by maximal-intensity projections that are perpendicular (left part of each frame) and parallel (right part) to the spindle axis during metaphase.
Figure 5
Figure 5. Chromosome movements during prometaphase and metaphase
(A) Examples of individual-chromosome behavior. The plots present changes in the distance between one spindle pole and each photoactivated kinetochore in a sister pair (orange and blue lines) as well as centromere stretch (green) from NEB through AO. One chromosome (top) exhibits oscillatory behavior; another chromosome remains relatively motionless during metaphase (middle) while the third chromosome switches between periods of oscillation and irregular movements (bottom). Deviation from Average Position (DAP) values are shown for periods marked by black lines. (B) Summary of oscillatory behavior for 50 individual chromosomes. Black blocks represent DAP <0.4 (non-oscillating behavior), white blocks correspond to DAP values exceeding 0.4 (oscillation). (C) Histogram of maximum velocity reached by kinetochores. (D) Displacements resulting from rapid (>8 µm/min) kinetochore movements. (E) Number of rapid kinetochore movements exhibited by individual chromosomes.
Figure 6
Figure 6. Centromere stretch and orientation during prometaphase
(A–B) Changes in the average value of interkinetochore distance (green lines) and centromere orientation with respect to the spindle axis (violet lines) during first 15 min after NEB in control (A) and Nuf2-depleted (B) cells. (C–D) Examples of the changes in the interkinetochore distance and centromere orientation in control (C) and Nuf2-depleted (D) cells. Yellow bars denote periods when persistent, proper alignment of the centromere has been achieved. Notice that interkinetochore distances do not change when centromeres become disoriented. (E) An example of centromere re-orientation during normal prometaphase (same kinetochore pair as in (C)). The kinetochore oriented to the left at 6:25 becomes oriented to the right at 7:15 (images; also see Movie S7). Note that the re-orientation occurs when the centromere resides close to the spindle equator. (F) Frequency of centromere disorientations at different stages of spindle assembly.
Figure 7
Figure 7. Fully congressed chromosomes can lack amphitelic attachment
DIC image (A) and maximal-intensity XY, XZ, and YZ projections of GFP fluorescence (B) of a fixed metaphase RPE1 cell expressing centrin1-GFP and CENP-A-GFP. (C) A higher-magnification view (XY projection) showing two pairs (1–2 and 3–4) of sister chromosomes positioned within the metaphase plate. (D–F) Serial 70-nm thin sections through the area presented in (C) demonstrate that kinetochores 1, 2, and 4 are attached to microtubule in the end-on fashion, which implies that the chromosome in the top half of the image is amphitelic. In contrast, kinetochore 3 lacks end-on attachment and it is shielded from the top spindle pole by a mass of chromatin positioned in front of the kinetochore. This kinetochore laterally interacts with microtubules of the K-fiber that terminates within kinetochore 2. Bars in A and B, 5 µm. Bars in C–F, 0.5 µm.

Comment in

References

    1. Allison DC, Nestor AL. Evidence for a relatively random array of human chromosomes on the mitotic ring. J Cell Biol. 1999;145:1–14. - PMC - PubMed
    1. Bakhoum SF, Genovese G, Compton DA. Deviant kinetochore-microtubule dynamics underlie chromosomal instability. Current Biology. 2009;19:R1032–R1034. - PMC - PubMed
    1. Blangy A, Lane HA, d'Herin P, Harper M, Kress M, Nigg EA. Phosphorilation by p34 cdc2 regulates spindle assosiation of human Eg5, a kinesin-related motor essential for bipolar spindle formation in vivo. Cell. 1995;83:1159–1169. - PubMed
    1. Cahu J, Olichon A, Hentrich C, Schek H, Drinjakovic J, Zhang C, Doherty-Kirby A, Lajoie G, Surrey T. Phosphorylation by Cdk1 increases the binding of Eg5 to microtubules in vitro and in Xenopus egg extract spindles. PLoS ONE. 2008;3:e3936. - PMC - PubMed
    1. Cai S, O'Connell CB, Khodjakov A, Walczak CE. Chromosome congression in the absence of kinetochore fibers. Nature Cell Biology. 2009;11:832–838. - PMC - PubMed

Publication types