. 2011 Oct 10;419(1):1-9.
doi: 10.1016/j.virol.2011.07.018. Epub 2011 Aug 19.

Differential requirements for clathrin endocytic pathway components in cellular entry by Ebola and Marburg glycoprotein pseudovirions

Affiliations

Differential requirements for clathrin endocytic pathway components in cellular entry by Ebola and Marburg glycoprotein pseudovirions

Suchita Bhattacharyya et al. Virology. .

Abstract

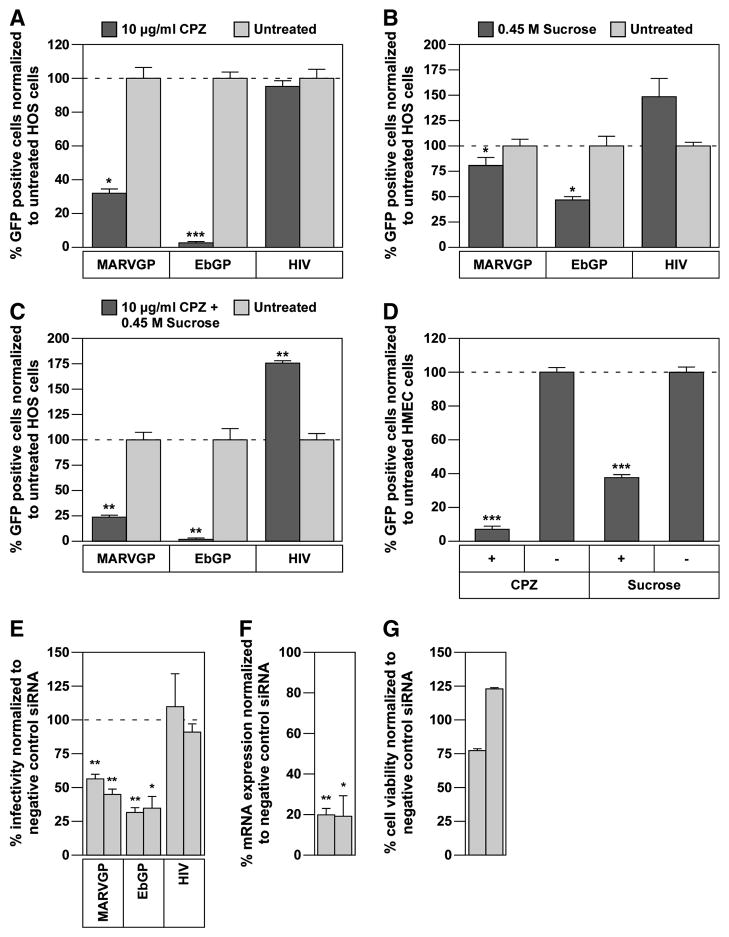
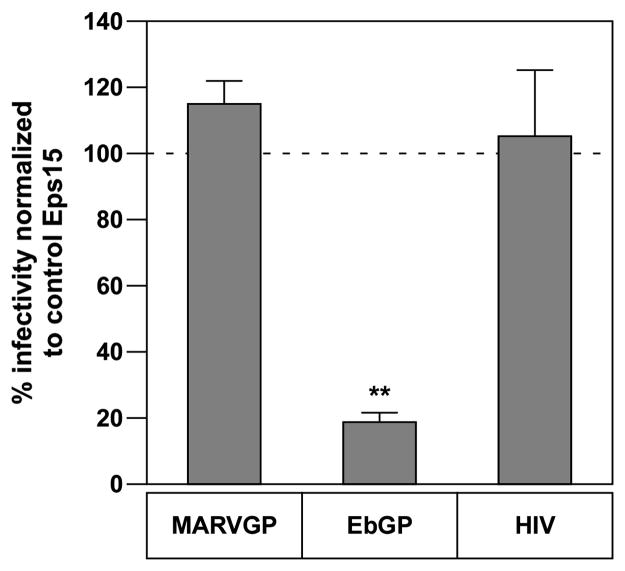
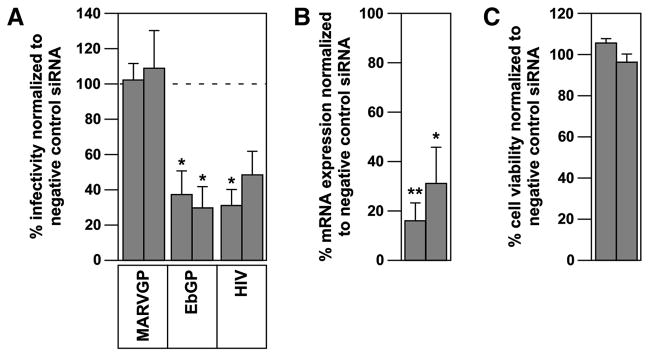
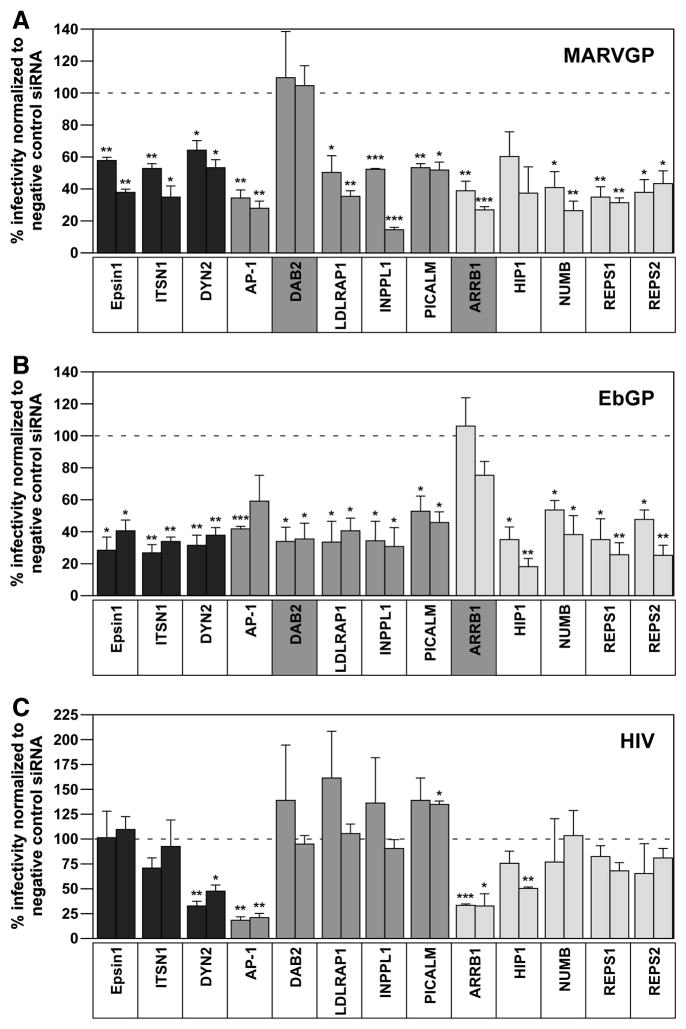
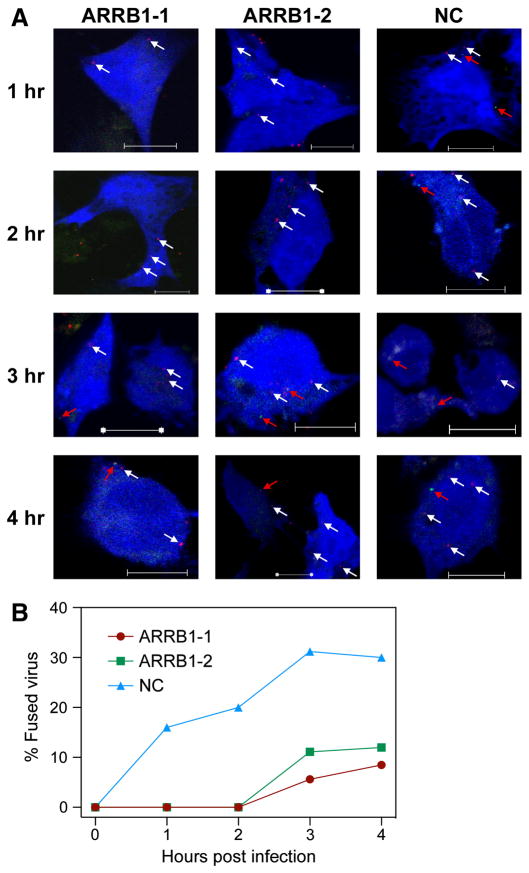
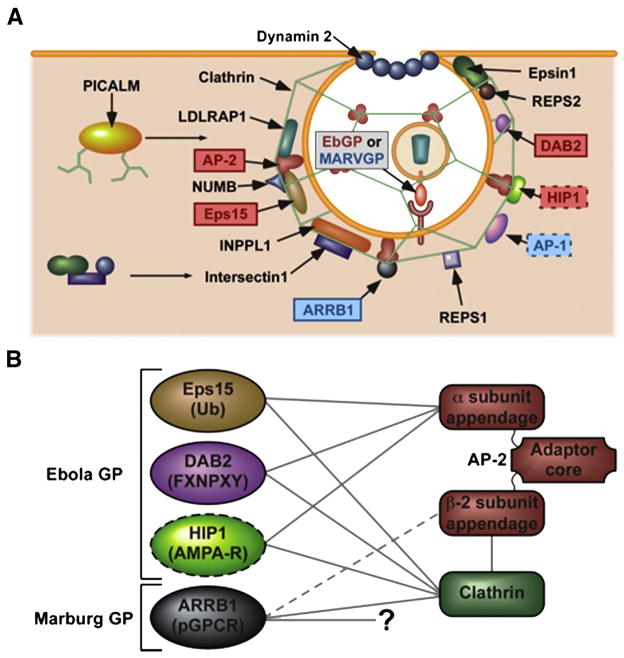
Clathrin-mediated endocytosis was previously implicated as one of the cellular pathways involved in filoviral glycoprotein mediated viral entry into target cells. Here we have further dissected the requirements for different components of this pathway in Ebola versus Marburg virus glycoprotein (GP) mediated viral infection. Although a number of these components were involved in both cases; Ebola GP-dependent viral entry specifically required the cargo recognition proteins Eps15 and DAB2 as well as the clathrin adaptor protein AP-2. In contrast, Marburg GP-mediated infection was independent of these three proteins and instead required beta-arrestin 1 (ARRB1). These findings have revealed an unexpected difference between the clathrin pathway requirements for Ebola GP versus Marburg GP pseudovirion infection. Anthrax toxin also uses a clathrin-, and ARRB1-dependent pathway for cellular entry, indicating that the mechanism used by Marburg GP pseudovirions may be more generally important for pathogen entry.


Figures

Fig. 1
Fig. 1. Chlorpromazine (CPZ), sucrose and RNAi-knockdown of clathrin heavy chain (CHC) inhibit Marburg GP mediated viral entry
(A) HOS cells were pre-treated with 10 μg/ml chlorpromazine for 45 min followed by incubation with a Marburg GP (MARVGP) or Ebola GP (EbGP) pseudotyped HIV-1 vector encoding GFP or wild type (WT) HIV overnight in the presence of the drug. 48 h post-infection, viral infectivity was measured by flow cytometry. Error bars represent SEM for three independent samples. * p Value for MARVGP < 0.05 and EbGP < 0.001. (B) HOS cells were pre-treated with 0.45 M sucrose for 10 min followed by incubation with the viruses described in panel (A) overnight in the presence of the drug. 48 h post-infection, viral infectivity was measured by flow cytometry. Error bars represent SEM for three independent samples. * p Values for MARVGP and EbGP < 0.05. (C) HOS cells were pre-treated with a combination of 10 μg/ml chlorpromazine and 0.45 M sucrose for 45 min followed by incubation with the viruses described in panel A overnight in the presence of the drugs. 48 h post-infection, viral infectivity was measured by flow cytometry. Error bars represent SEM for three independent samples. * p Values for MARVGP, EbGP and HIV < 0.01. (D) HMEC cells were pre-treated with 10 μg/ml chlorpromazine for 45 min or 0.45 M sucrose for 10 min followed by incubation with the MARVGP pseudotyped virus overnight in the presence of the drug. Viral infectivity was measured at 48 h post-infection by flow cytometry. Error bars represent SEM for three independent samples. * p Values for CPZ and sucrose < 0.001. (E) HOS cells were co-transfected with two siRNAs against CHC and a tdTomato plasmid (as a transfection marker) followed by infection with the viruses as described in panel (A). The data is represented as % infectivity in specific siRNA-transfected cells normalized to non-targeting siRNA transfected cells. Individual bars represent single siRNAs. Error bars represent SEM for three independent experiments. * p Values for MARVGP siRNAs < 0.01 and for EbGP: siRNA 1 < 0.01, siRNA 2 < 0.05. (F) HOS cells were transfected with two siRNAs against CHC as described in the materials and methods section. mRNA expression levels were measured by qPCR and normalized to cellular beta-actin mRNA expression levels. Individual bars represent single siRNAs. Error bars represent SEM for three independent experiments. * p Values for siRNA 1 < 0.01 and siRNA 2 < 0.05. (G) HOS cells were transfected with two siRNAs against CHC as described in the materials and methods section and cell viability was measured using the Cell Titer Glo reagent (Promega). Data from one representative experiment is shown in the figure. Individual bars represent single siRNAs. Error bars represent standard deviation for eight replicates.
Fig. 2
Fig. 2. Dominant-negative Eps15 does not inhibit Marburg GP mediated viral entry
HOS cells were plated on coverslips and transfected with mRFP-DIII (dominant-negative, DN) or D3Δ2 (control) Eps15 plasmids. 24 h post-transfection, EbGP, MARVGP pseudotyped viruses or WT-HIV was added to the cells for 4 h. 48 h post-infection, the cells were fixed and the DNA was stained with Hoechst. Several panels of images were collected from each coverslip. The number of transfected only and transfected and infected cells was counted in each panel and the percentage of transfected and infected cells was determined. Graph represents % decline in viral infectivity in DN Eps15 transfected cells normalized to control Eps15 transfected cells. Error bars represent SEM for three independent experiments. * p Value for % decline in EbGP infectivity compared to MARVGP and HIV is < 0.01.
Fig. 3
Fig. 3. Ebola GP requires AP-2 for entry but Marburg GP does not
(A) HOS cells were co-transfected with two siRNAs against AP-2 and a tdTomato plasmid (as a transfection marker) followed by infection with the viruses as described in the materials and methods section. The data is represented as % infectivity in specific siRNA-transfected cells compared to non-targeting siRNA transfected cells. Individual bars represent single siRNAs. Error bars represent SEM for three independent experiments. * p Values for EbGP siRNAs and for HIV siRNA 1 < 0.05. (B) HOS cells were transfected with two siRNAs against AP-2 as described in the materials and methods section. The mRNA expression levels were measured by qPCR and normalized to cellular beta-actin mRNA expression levels. Individual bars represent single siRNAs. Error bars represent SEM for three independent experiments. * p Value for siRNA 1 < 0.01 and siRNA 2 < 0.05. (C) HOS cells were transfected with two siRNAs against AP-2 as described in the materials and methods section and cell viability was measured using the Cell Titer Glo reagent (Promega). Data from one representative experiment is shown in the figure. Individual bars represent single siRNAs. Error bars represent standard deviation for eight replicates.
Fig. 4
Fig. 4. Ebola and Marburg GP mediated entry have differential requirements for DAB2 and ARRB1
(A) HOS cells were co-transfected with two siRNAs each against epsin 1, ITSN1, DYN2, AP1M1, DAB2, LDLRAP1, INPPL1, PICALM, ARRB1, HIP1, NUMB, REPS1 and REPS2 and a tdTomato plasmid (as a transfection marker) followed by infection with the MARVGP pseudotyped virus as described in the materials and methods section. The data is represented as % infectivity in specific siRNA-transfected cells normalized to non-targeting siRNA transfected cells. Individual bars represent single siRNAs for each gene. Error bars represent SEM for three independent experiments. * p Values for epsin1, AP1M1 and REPS1 siRNAs < 0.01; ITSN1: siRNA 1 < 0.01, siRNA 2 < 0.05; DYN2 and REPS2 siRNAs < 0.05; LDLRAP1: siRNA 1 < 0.05, siRNA 2 < 0.01; INPPL1 siRNAs < 0.001; PICALM: siRNA 1 < 0.01, siRNA 2 < 0.05; ARRB1: siRNA 1 < 0.01, siRNA 2 < 0.001 and NUMB: siRNA 1 < 0.05, siRNA 2 < 0.01. (B) HOS cells were co-transfected with the siRNAs described in panel (A) and a tdTomato plasmid followed by infection with the EbGP pseudotyped virus as described in the materials and methods section. The data is represented as % infectivity in specific siRNA-transfected cells normalized to non-targeting siRNA transfected cells. Individual bars represent single siRNAs for each gene. Error bars represent SEM for three independent experiments. * p Values for epsin1, DAB2, LDLRAP1, INPPL1, PICALM and NUMB siRNAs < 0.05; ITSN1 and DYN2 siRNAs < 0.01; AP1M1 siRNA 1 = 0.001; HIP1: siRNA 1 < 0.05, siRNA 2 < 0.01; REPS1: siRNA 1 < 0.05, siRNA 2 < 0.01 and REPS2: siRNA 1 < 0.05, siRNA 2 < 0.01. (C) HOS cells were co-transfected with the siRNAs described in panel (A) and a tdTomato plasmid followed by infection with WT-HIV as described in the materials and methods section. The data is represented as % infectivity in specific siRNA-transfected cells normalized to non-targeting siRNA transfected cells. Individual bars represent single siRNAs for each gene. Error bars represent SEM for three independent experiments. * p Values for DYN2: siRNA1 < 0.01, siRNA 2 < 0.05; AP1M1 siRNAs < 0.01; PICALM: siRNA 2 < 0.05; ARRB1: siRNA 1 < 0.001, siRNA 2 < 0.05 and HIP1: siRNA 2 < 0.01.
Fig. 5
Fig. 5. ARRB1 is required for efficient MARVGP pseudovirion fusion
(A) HOS cells were co-transfected with siRNAs against ARRB1 or negative control (NC) and TagBFP plasmid (as a transfection marker) and challenged with S15-mCherry and GFP-Vpr double-labeled MARVGP pseudotyped virus. At various time points, the cells were fixed and several panels of images were collected for each sample. The total numbers of S15-mCherry and GFP-Vpr double-positive virus particles (yellow) as well as GFP-Vpr single-positive virus particles (green) were counted in the BFP positive (blue) cells. Representative images from each time point are shown. The white arrows indicate S15-mCherry and GFP-Vpr double-positive virus particles (unfused virus) and the red arrows point towards GFP-Vpr single-positive virus particles (fused virus). Scale bars represent 10 μm. (B) The total numbers of S15-mCherry and GFP-Vpr double-positive virions as well as GFP-Vpr single-positive virions in BFP positive cells were counted in the various panels of images collected from each sample above. The loss of S15-mCherry signal corresponding to fused virions was calculated for every sample for all the time points. Graph represents percentage of fused virions for each sample at various time points. The initial viral input level was normalized to 100 %.
Fig. 6
Fig. 6. Schematic representation of the differential requirements for various components of the clathrin pathway in Ebola GP versus Marburg GP pseudotyped viral entry
(A) Ebola GP requires Eps15, AP-2, DAB2 and possibly HIP1 for its entry. In contrast, Marburg GP mediated entry is independent of these factors but instead requires ARRB1 and AP-1. Both viruses require CHC, epsin 1, ITSN1, DYN2, LDLRAP1, INPPL1, PICALM, NUMB, REPS1 and REPS2. The interactions of the factors with each other and also their roles in the formation of clathrin vesicles are depicted. (B) Eps15, DAB2 and HIP1, which are required by EbGP mediated virus entry are known to bind to the alpha-appendage of AP-2. In contrast ARRB1, which is required by MARVGP mediated virus entry is known to bind to the beta-appendage of AP-2. The target sequences recognized by these proteins are shown in parentheses. Figure adapted from (Traub, 2003) and (Traub, 2009).

Similar articles

Cited by

References

    1. Abrami L, Bischofberger M, Kunz B, Groux R, van der Goot FG. Endocytosis of the anthrax toxin is mediated by clathrin, actin and unconventional adaptors. PLoS Pathog. 2010;6(3):e1000792. - PMC - PubMed
    1. Alvarez CP, Lasala F, Carrillo J, Muniz O, Corbi AL, Delgado R. C-type lectins DC-SIGN and L-SIGN mediate cellular entry by Ebola virus in cis and in trans. J Virol. 2002;76(13):6841–4. - PMC - PubMed
    1. Bavari S, Bosio CM, Wiegand E, Ruthel G, Will AB, Geisbert TW, Hevey M, Schmaljohn C, Schmaljohn A, Aman MJ. Lipid raft microdomains: a gateway for compartmentalized trafficking of Ebola and Marburg viruses. J Exp Med. 2002;195(5):593–602. - PMC - PubMed
    1. Benmerah A, Gagnon J, Begue B, Megarbane B, Dautry-Varsat A, Cerf-Bensussan N. The tyrosine kinase substrate eps15 is constitutively associated with the plasma membrane adaptor AP-2. J Cell Biol. 1995;131(6 Pt 2):1831–8. - PMC - PubMed
    1. Bhattacharyya S, Warfield KL, Ruthel G, Bavari S, Aman MJ, Hope TJ. Ebola virus uses clathrin-mediated endocytosis as an entry pathway. Virology. 2010;401(1):18–28. - PMC - PubMed

Publication types

MeSH terms