. 2011 Aug 19;43(4):515-27.
doi: 10.1016/j.molcel.2011.06.024.

Commitment to a cellular transition precedes genome-wide transcriptional change

Affiliations

Commitment to a cellular transition precedes genome-wide transcriptional change

Umut Eser et al. Mol Cell. .

Abstract

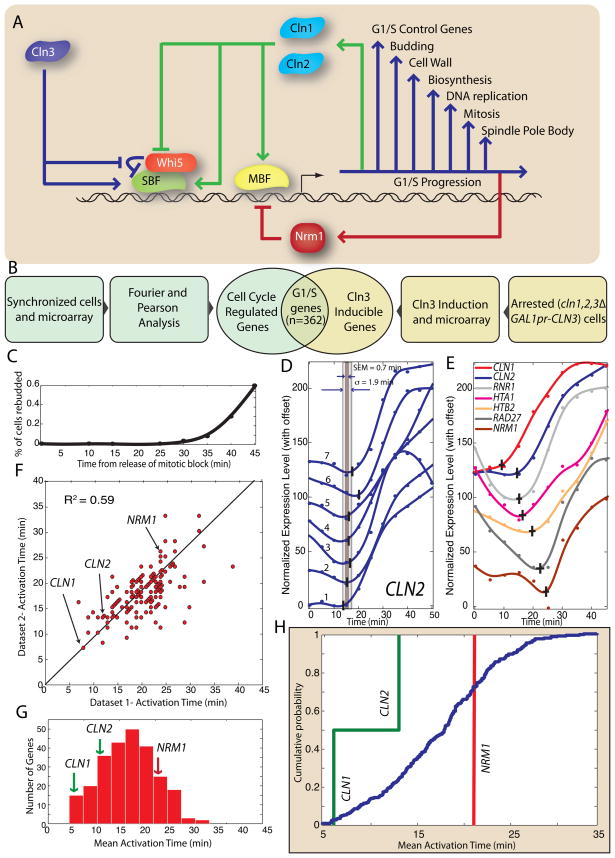
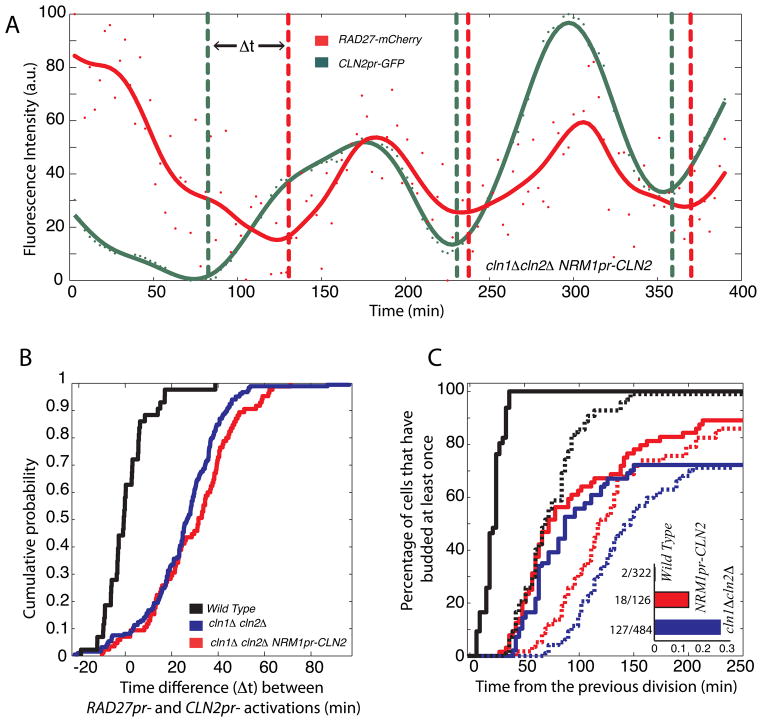
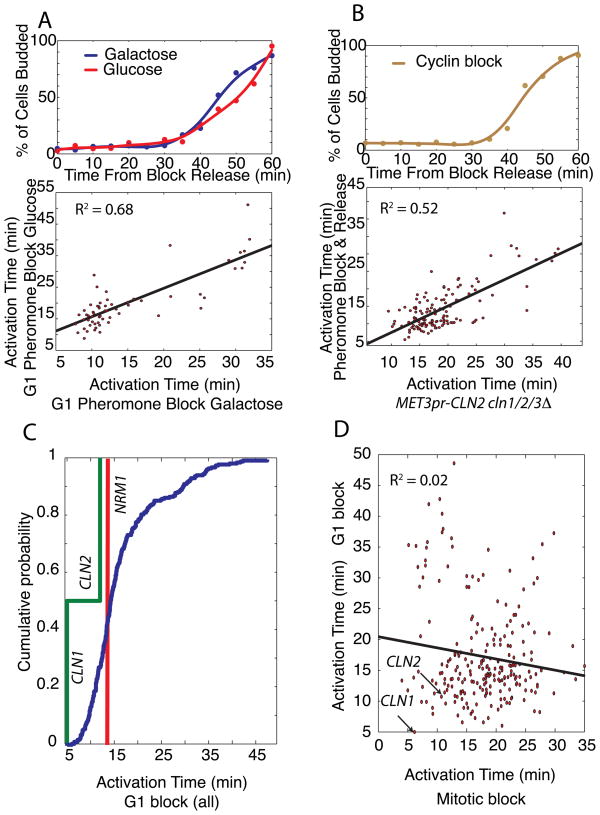
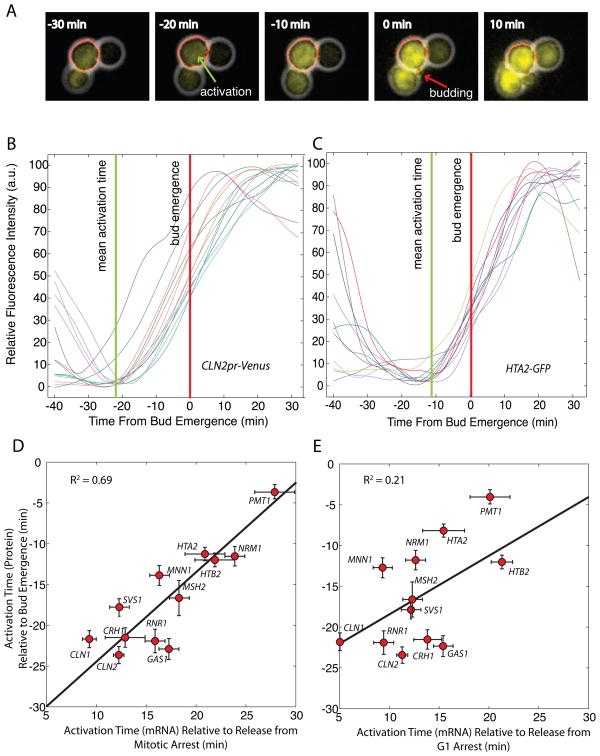
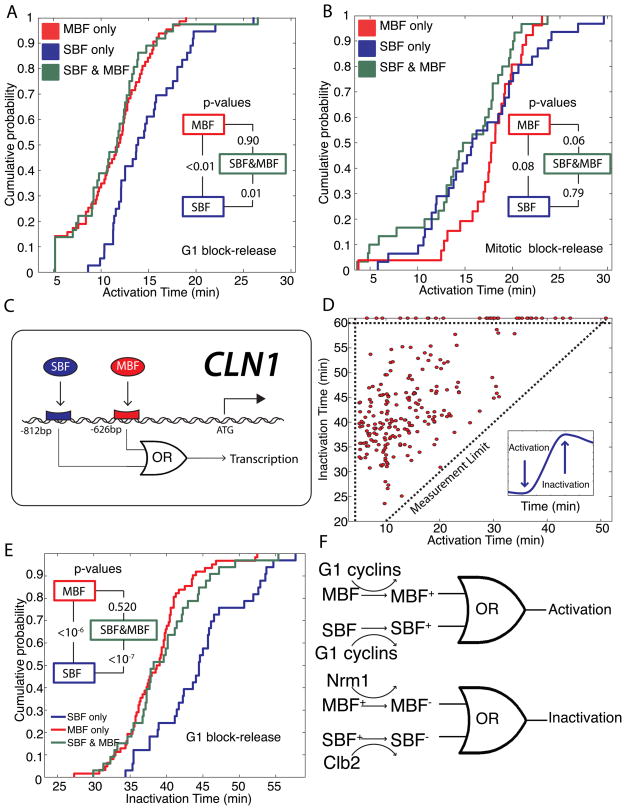
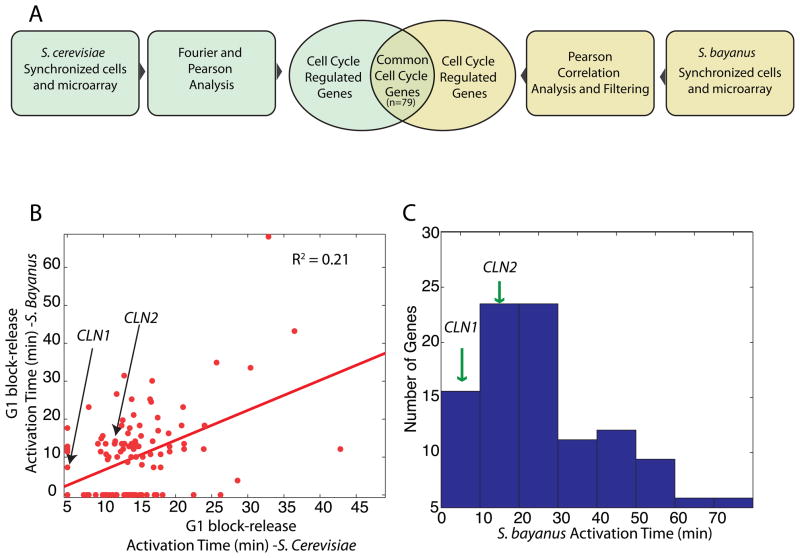
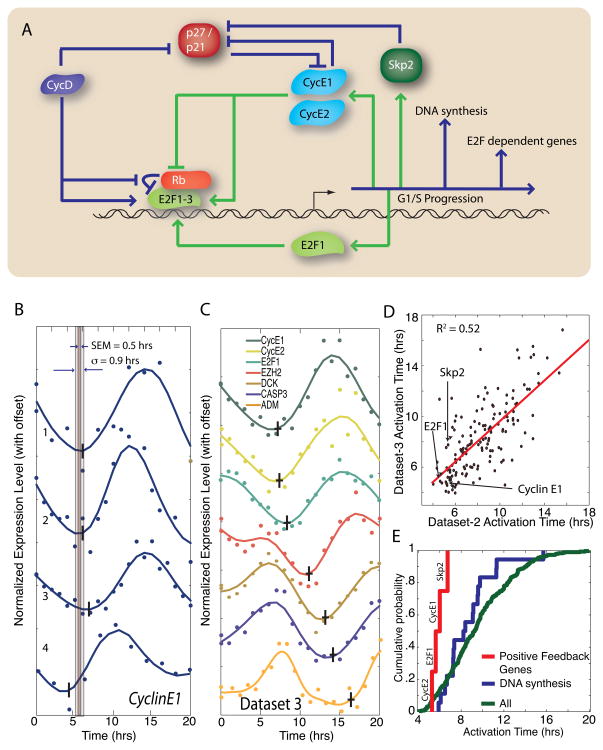
In budding yeast, commitment to cell division corresponds to activating the positive feedback loop of G1 cyclins controlled by the transcription factors SBF and MBF. This pair of transcription factors has over 200 targets, implying that cell-cycle commitment coincides with genome-wide changes in transcription. Here, we find that genes within this regulon have a well-defined distribution of transcriptional activation times. Combinatorial use of SBF and MBF results in a logical OR function for gene expression and partially explains activation timing. Activation of G1 cyclin expression precedes the activation of the bulk of the G1/S regulon, ensuring that commitment to cell division occurs before large-scale changes in transcription. Furthermore, we find similar positive feedback-first regulation in the yeasts S. bayanus and S. cerevisiae, as well as human cells. The widespread use of the feedback-first motif in eukaryotic cell-cycle control, implemented by nonorthologous proteins, suggests its frequent deployment at cellular transitions.


Figures

Figure 1
Figure 1. Positive feedback precedes genome-wide change in transcription at G1/S in S. cerevisiae
(A) Schematic diagram of the G1/S transition. (B) The G1/S regulon is defined as the intersection of the set of cell cycle regulated genes with the set of Cln3-inducible genes. (C) Synchrony of cdc20Δ GALLpr-CDC20 metaphase block-release from Di Talia et al (2009). (D) An algorithm is applied to a smoothing-spline fit to detect activation of CLN2 transcription in 7 mitotic block-release datasets (See Figures S1-3 for algorithm description; specific genotypes of Datasets 1–7 described in Figure S1D). The standard deviation σ and the standard error of the mean (SEM) is calculated for each gene. (E) 7 genes in the G1/S regulon are activated at different times; data shown from a single dataset. The vertical and horizontal bars indicate the activation time and its SEM respectively. (F) Gene activation time correlation between two of the 7 datasets (R2 = 0.59; see supplementary information for additional correlations). Histogram (G) and corresponding cumulative distribution (H) of mean activation times for the 7 mitotic block-release datasets. CLN1 and CLN2, two genes responsible for positive feedback, are among the earliest-activated genes. NRM1, a negative regulator of MBF, is activated later.
Figure 2
Figure 2. Phenotypic consequences of delayed positive feedback
(A) Time course of incoherent RAD27-mCherry and CLN2pr-GFP expression in a single cln1Δ cln2Δ NRM1pr-CLN2 cell. (B) Time difference between CLN2pr and RAD27pr induction measured as in Skotheim et al (2008); cells not showing significant induction of either promoter were omitted from the analysis. (C) A cumulative plot for the first bud emergence measured from cell division. Solid and dashed lines correspond to mother and daughter cells respectively. Inset shows fraction of G1-arrested cells.
Figure 3
Figure 3. Synchronization phase, but not carbon source or synchronization method, affects gene activation timing
(A) Bud-index measurements and gene activation time correlation for G1 pheromone block-release time-course microarray experiments with glucose or galactose carbon sources. (B) Bud index for G1 block-release using cln1Δ cln2Δ cln3Δ MET3pr-CLN2 cells and correlation of gene activation times for pheromone and G1 cyclin block-release experiments. (C) Significant correlation between the 3 G1 block-release datasets allows them to be pooled together to produce a histogram of activation times for the G1/S regulon again demonstrating feedback-first regulation. (D) Activation times from G1 and mitotic block-release experiments are not correlated.
Figure 4
Figure 4. Gene activation is correlated in the free running cell cycle and mitotic block-release experiments
(A) Composite phase and fluorescence images of CLN2pr-VenusPEST cells. Venus yellow fluorescent protein contains a destabilizing PEST sequence. The red contour denotes the cell boundary detected by automatic segmentation. Gene activation time calculated from fluorescence intensity time courses aligned at bud emergence for (B) CLN2pr-VenusPEST and (C) HTA2-GFP cells. Gene activation times ± SEM for 10 strains containing GFP-fused proteins and 2 strains containing promoter-Venus constructs expressed at the endogenous locus correlated with mean activation times from microarray time-courses for cells synchronized at mitosis (D) or G1 (E).
Figure 5
Figure 5. SBF and MBF dual-regulated promoters act as logical OR gates in response to activation and inactivation signals
Cumulative probability of activation times for SBF-only, MBF-only and SBF/MBF dual-regulated targets are plotted for (A) G1 block-release and (B) mitotic block-release experiments. Inset shows p-values comparing each pair of distributions. (C) Schematic showing logical regulation of the early-activated CLN1 promoter denoting SBF and MBF consensus binding sites. (D) Inactivation time for each gene, where the 1st derivative is zero and the 2nd derivative is negative (inset), is uncorrelated with activation for G1 block-release experiments. Points above the horizontal dotted line represent genes peaking later than 60 min. (E) Cumulative probability of inactivation for SBF-only, MBF-only and SBF/MBF dual targets for G1 block-release experiments. Inset shows p-values comparing each pair of distributions. (F) The transcriptional activation and inactivation can be modeled as a logical OR gate. For dual-regulated genes, activating either SBF or MBF suffices for activation, while inactivating MBF suffices for inactivation. Different colors denote different possible states of a transcription factor.
Figure 6
Figure 6. Feedback-first regulation is conserved in the budding yeast S. bayanus.
Activation times are analyzed for all cell cycle regulated genes in a S. bayanus pheromone block-release microarray time-course (Guan, Dunham et al. 2010). (A) Intersection of cell cycle regulated genes in both budding yeasts. (B) Weak correlation between gene activation times in S. bayanus and S. cerevisiae for G1 block-release experiments. (C) Histogram of activation times of the cell cycle regulated genes in S. bayanus indicates that the G1 cyclins responsible for positive feedback, CLN1 and CLN2, are among the early-activated genes.
Figure 7
Figure 7. Feedback-first regulation is conserved in human cells
(A) Schematic diagram of G1/S regulation in human cells. (B) Cyclin E1 activation is consistent in 4 different cell cycle synchronized microarray experiments from Whitfield et al. (2002). The standard deviation σ and the standard error of the mean (SEM) is calculated for each gene. (C) 7 genes regulated by the E2F family of transcription factors are activated at different times; data shown from a single dataset. The vertical and horizontal bars indicate the mean activation time and the SEM respectively. (D) Gene activation time correlation between 2 datasets (R2 = 0.52). (E) Cumulative distribution of mean activation times for cell cycle regulated E2F-targets. Genes responsible for positive feedback at the G1/S transition, including the cyclins E1 and E2 the transcription factor E2F1, and the SCF component Skp2, are transcribed earlier than other E2F-targets (p<0.01) and earlier than the set of E2F targets specifically involved in DNA replication (p=0.03). This demonstrates the conservation of feedback-first regulation in eukaryotes.

Comment in

References

    1. Amon A, Tyers M, et al. Mechanisms that help the yeast cell cycle clock tick: G2 cyclins transcriptionally activate G2 cyclins and repress G1 cyclins. Cell. 1993;74(6):993–1007. - PubMed
    1. Andrews BJ, Herskowitz I. Identification of a DNA binding factor involved in cell-cycle control of the yeast HO gene. Cell. 1989;57(1):21–9. - PubMed
    1. Bai L, Charvin G, et al. Nucleosome-depleted regions in cell-cycle-regulated promoters ensure reliable gene expression in every cell cycle. Dev Cell. 2010;18(4):544–55. - PMC - PubMed
    1. Bean JM, Siggia ED, et al. Coherence and timing of cell cycle Start examined at single-cell resolution. Mol Cell. 2006;21(1):3–14. - PubMed
    1. Blagosklonny MV, Pardee AB. The restriction point of the cell cycle. Cell Cycle. 2002;1(2):103–10. - PubMed

Publication types

MeSH terms

Substances

Associated data