

Localization of the subthalamic nucleus in Parkinson disease using multiunit activity
- PMID: 21855895
- PMCID: PMC3195940
- DOI: 10.1016/j.jns.2011.07.027
Localization of the subthalamic nucleus in Parkinson disease using multiunit activity
Abstract
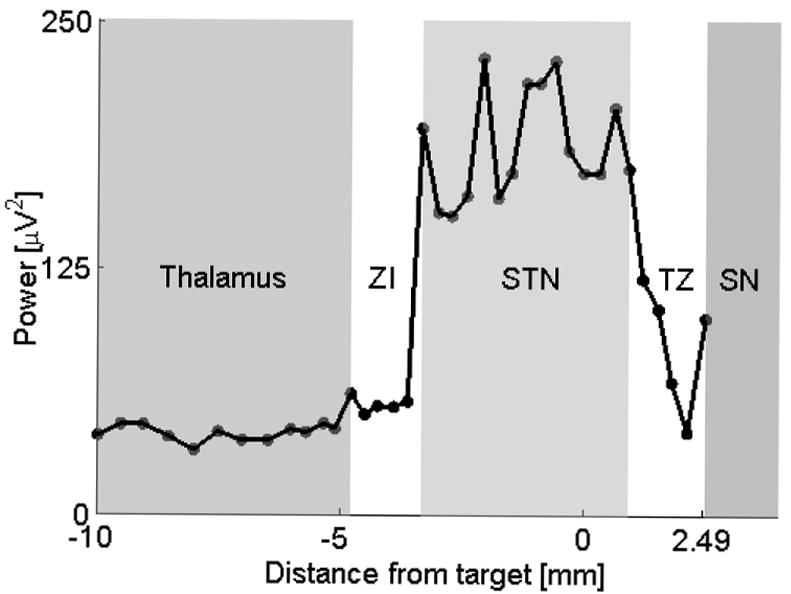
Background: Refinement of the subthalamic nucleus (STN) coordinates using intraoperative microelectrode recordings (MER) is routinely performed during deep brain stimulation (DBS) surgeries in Parkinson disease (PD). The commonly used criteria for electrophysiological localization of the STN are qualitative. The goal of this study was to validate quantitative STN detection algorithm (QD) derived from the multi-unit activity in a prospective setting.
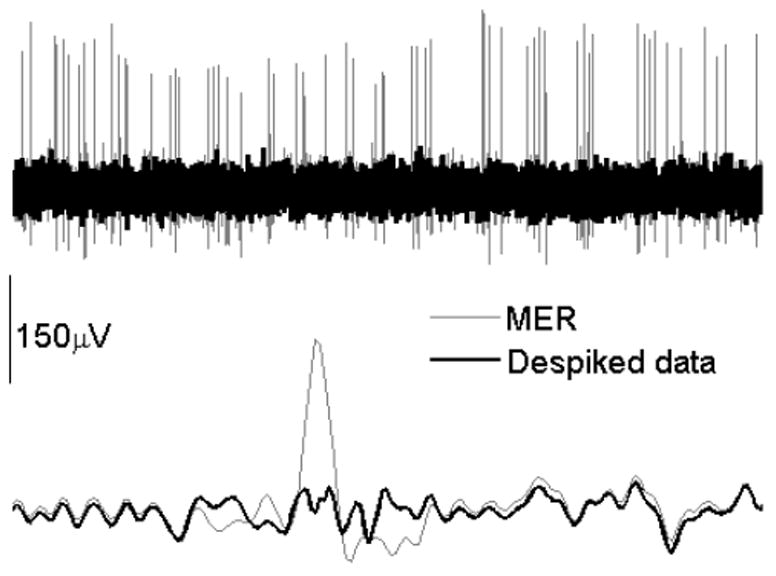
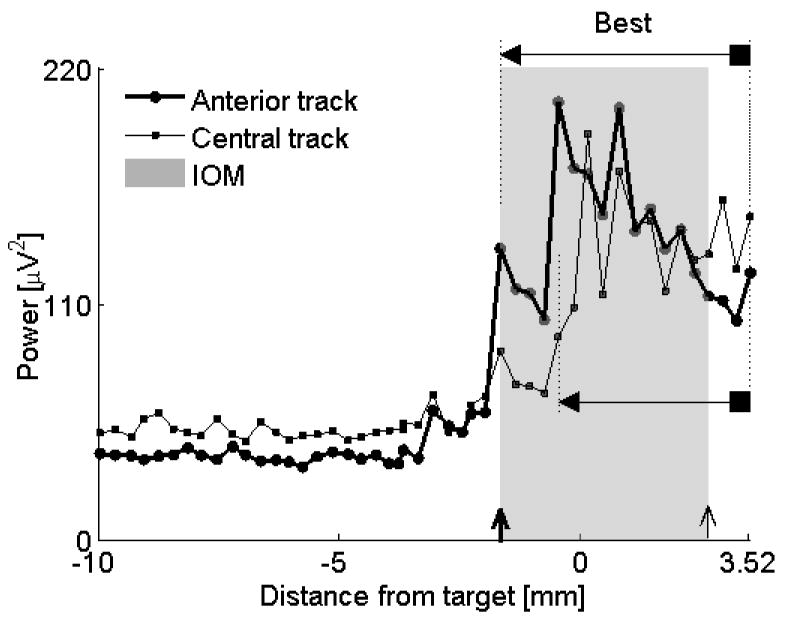
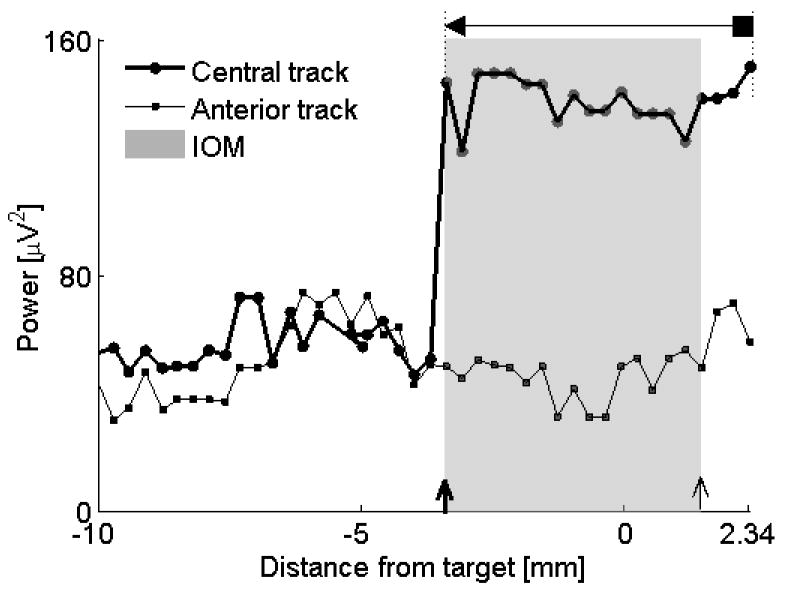
Methods: Ten PD patients underwent STN DBS surgery. The MUA was obtained by removing large spikes close to microelectrode using wavelet method and integrating the 500-2000Hz band in the power spectral density. The qualitative intraoperative mapping of the STN using MER (IOM) versus QD was compared using Bland-Altman and Pearson's correlation analysis.
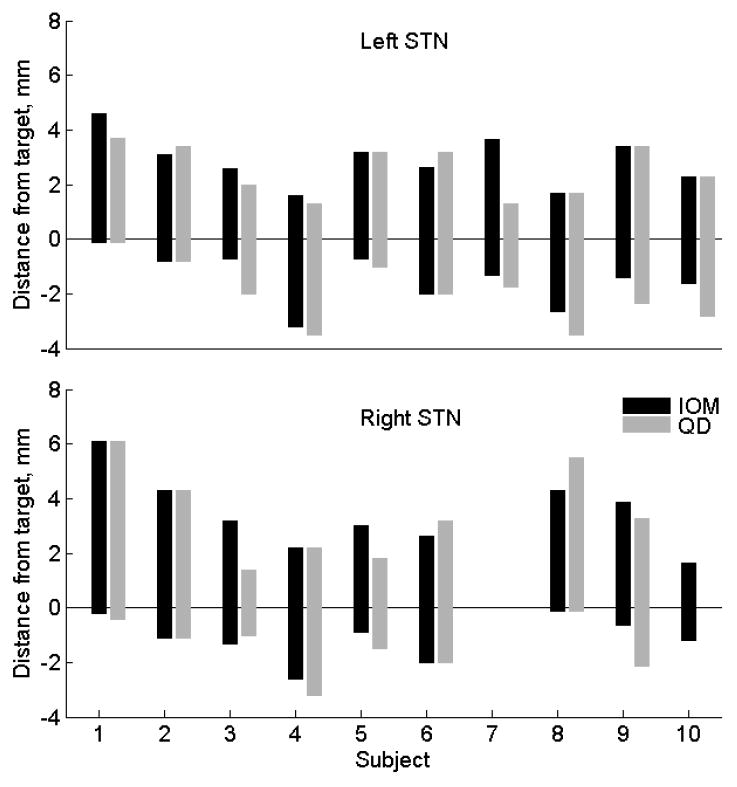
Results: The clinical efficacy was confirmed in all subjects. The mean difference between IOM and QD of the dorsal/ventral border was 0.31±0.84/0.44±0.47mm. Using Bland-Altman statistic, only 2/36 (5.6%) differences (one for the dorsal border and one for the ventral border) were out of ±2 sd line of measurement differences. Correlation between dorsal border/ventral border positions obtained by IOM and QD was 0.79, p<0.0001/0.91, p<0.0001.
Conclusion: Both methods are in reasonable agreement and are strongly correlated. The QD gives objective coordinates of the STN borders at high precision and may be more accurate than IOM. Prospective blinded comparative studies where the DBS leads will be placed using either QD or IOM are warranted.
Copyright © 2011 Elsevier B.V. All rights reserved.
Figures
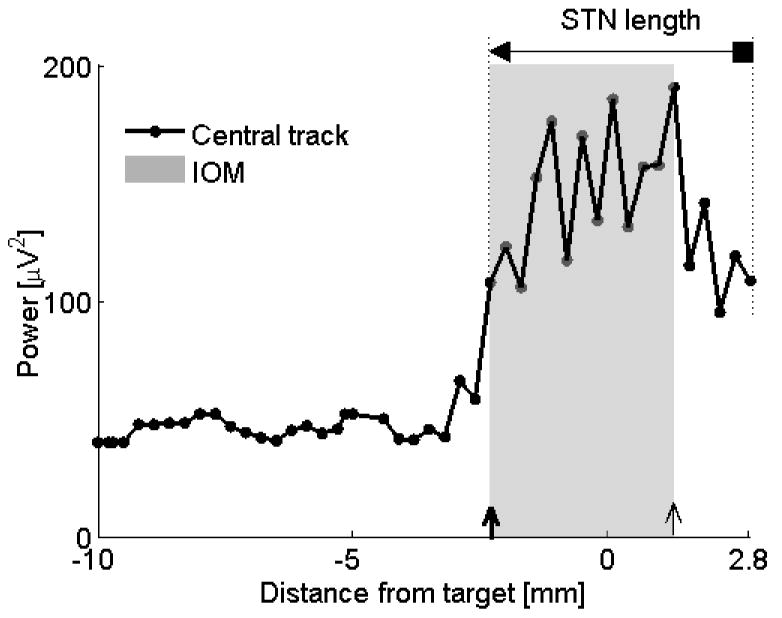
 = dorsal border using IOM, ↑ = ventral border using IOM. Shaded rectangle demarcates the STN derived from the IOM.
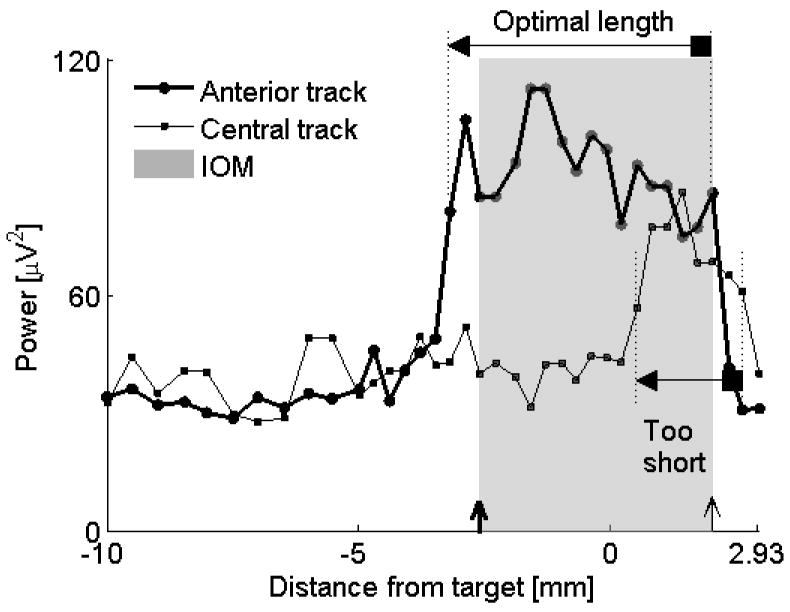
Similar articles
-
Multi-parametric analysis assists in STN localization in Parkinson's patients.J Neurol Sci. 2016 Jul 15;366:37-43. doi: 10.1016/j.jns.2016.04.043. Epub 2016 Apr 23. J Neurol Sci. 2016. PMID: 27288773
-
Defining the Dorsal STN Border Using 7.0-T MRI: A Comparison to Microelectrode Recordings and Lower Field Strength MRI.Stereotact Funct Neurosurg. 2019;97(3):153-159. doi: 10.1159/000500109. Epub 2019 Aug 20. Stereotact Funct Neurosurg. 2019. PMID: 31430753 Free PMC article.
-
Spectral analysis of field potential recordings by deep brain stimulation electrode for localization of subthalamic nucleus in patients with Parkinson's disease.Stereotact Funct Neurosurg. 2009;87(4):211-8. doi: 10.1159/000225974. Epub 2009 Jun 26. Stereotact Funct Neurosurg. 2009. PMID: 19571612 Clinical Trial.
-
Theta-alpha oscillations characterize emotional subregion in the human ventral subthalamic nucleus.Mov Disord. 2020 Feb;35(2):337-343. doi: 10.1002/mds.27910. Epub 2019 Nov 23. Mov Disord. 2020. PMID: 31758821
-
Anesthetic Effect on the Subthalamic Nucleus in Microelectrode Recording and Local Field Potential of Parkinson's Disease.Neuromodulation. 2025 Apr;28(3):414-424. doi: 10.1016/j.neurom.2024.04.002. Epub 2024 Jun 9. Neuromodulation. 2025. PMID: 38852085 Review.
Cited by
-
Mapping of subthalamic nucleus using microelectrode recordings during deep brain stimulation.Sci Rep. 2020 Nov 6;10(1):19241. doi: 10.1038/s41598-020-74196-5. Sci Rep. 2020. PMID: 33159098 Free PMC article. Clinical Trial.
-
Phase-dependent modulation as a novel approach for therapeutic brain stimulation.Front Comput Neurosci. 2015 Feb 26;9:26. doi: 10.3389/fncom.2015.00026. eCollection 2015. Front Comput Neurosci. 2015. PMID: 25767446 Free PMC article.
-
A Computerized Microelectrode Recording to Magnetic Resonance Imaging Mapping System for Subthalamic Nucleus Deep Brain Stimulation Surgery.Oper Neurosurg. 2018 Jun 1;14(6):661-667. doi: 10.1093/ons/opx169. Oper Neurosurg. 2018. PMID: 28961898 Free PMC article.
-
Functional Use of Directional Local Field Potentials in the Subthalamic Nucleus Deep Brain Stimulation.Front Hum Neurosci. 2020 Apr 28;14:145. doi: 10.3389/fnhum.2020.00145. eCollection 2020. Front Hum Neurosci. 2020. PMID: 32410972 Free PMC article.
-
A low-power band of neuronal spiking activity dominated by local single units improves the performance of brain-machine interfaces.Nat Biomed Eng. 2020 Oct;4(10):973-983. doi: 10.1038/s41551-020-0591-0. Epub 2020 Jul 27. Nat Biomed Eng. 2020. PMID: 32719512 Free PMC article.
References
-
- Benabid AL, Chabardes S, Mitrofanis J, Pollak P. Deep brain stimulation of the subthalamic nucleus for the treatment of Parkinson’s disease. Lancet Neurol. 2009;8:67–81. - PubMed
-
- Marceglia S, Mrakic-Sposta S, Tommasi G, Bartolomei L, Foresti C, Valzania F, Galati S, Stefani A, Tamma F, Priori A. DBS Study Group of The Italian Neurological Society. Multicenter study report: electrophysiological monitoring procedures for subthalamic deep brain stimulation surgery in Parkinson’s disease. Neurol Sci. 2010;31:449–457. - PubMed
-
- Benazzouz A, Breit S, Koudsie A, Pollak P, Krack P, Benadib AL. Intraoperative microrecordings of the subthalamic nucleus in Parkinson’s disease. Mov Disord. 2002;17:S145–S149. - PubMed
-
- Pesenti A, Rohr M, Egidi M, Rampini P, Tamma F, Locatelli M, Caputo E, Chiesa V, Bianchi A, Barbieri S, Baselli G, Priori A. The subthalamic nucleus in Parkinson’s disease: power spectral density analysis of neural intraoperative signals. Neurol Sci. 2004;24:367–374. - PubMed
Publication types
MeSH terms
Grants and funding
LinkOut - more resources
Full Text Sources
Other Literature Sources
Medical
Miscellaneous
