. 2012 May;70(5):1081-92.
doi: 10.1016/j.joms.2011.05.002.

Effects of pamidronate on human alveolar osteoblasts in vitro

Affiliations

Effects of pamidronate on human alveolar osteoblasts in vitro

Darja Marolt et al. J Oral Maxillofac Surg. 2012 May.

Abstract

Purpose: Administration of bisphosphonates has recently been associated with the development of osteonecrotic lesions of the jaw (ONJ). To elucidate the potential contributions of osteogenic cells to the development and regeneration of ONJ, we have isolated primary cells from human alveolar and long/iliac bones, and examined the effects of pamidronate on cell viability, proliferation, osteogenesis, and wound healing.

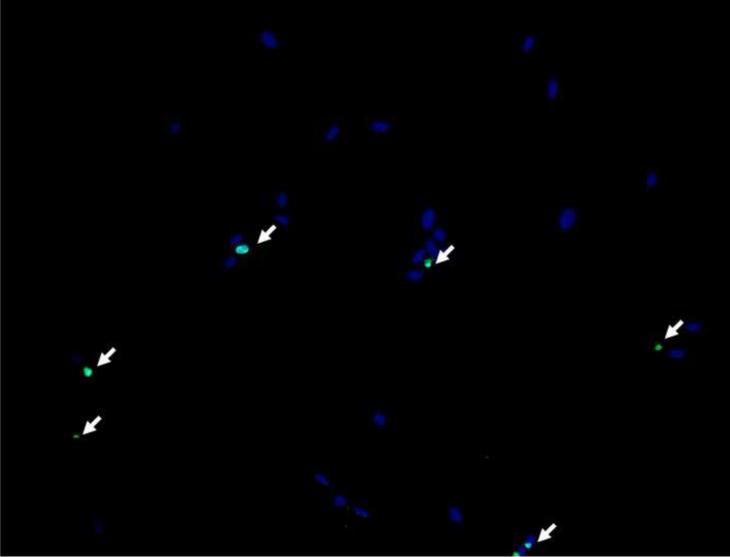
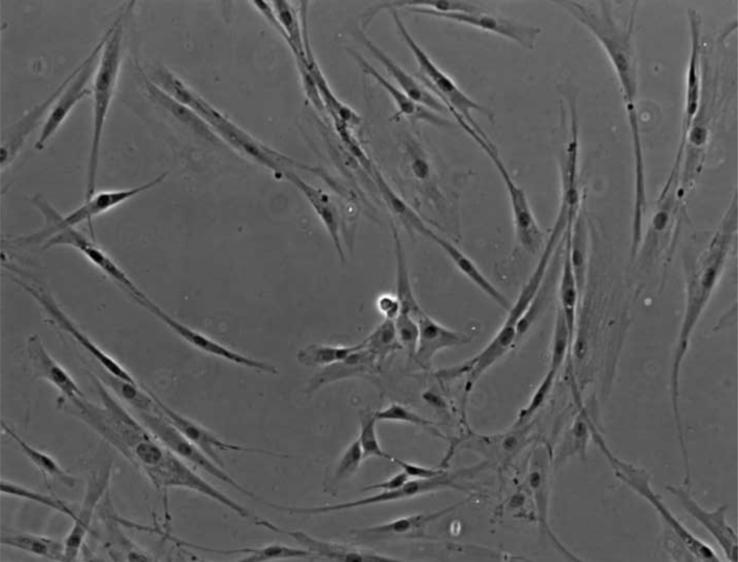
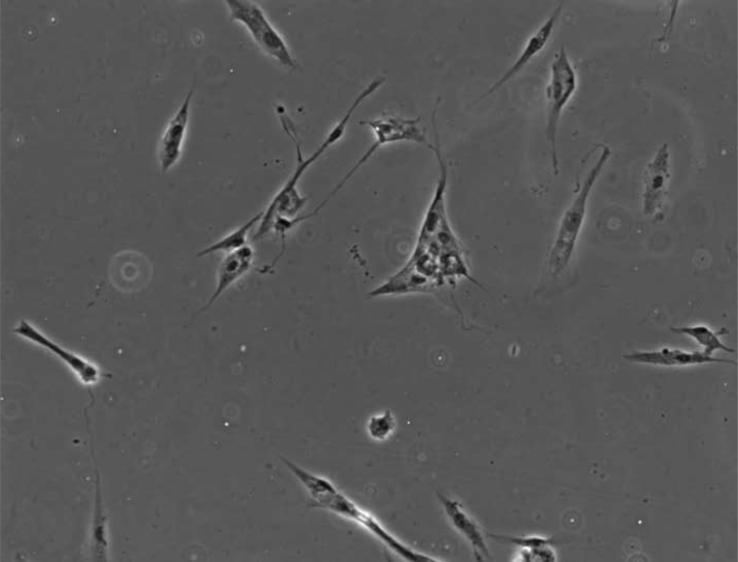
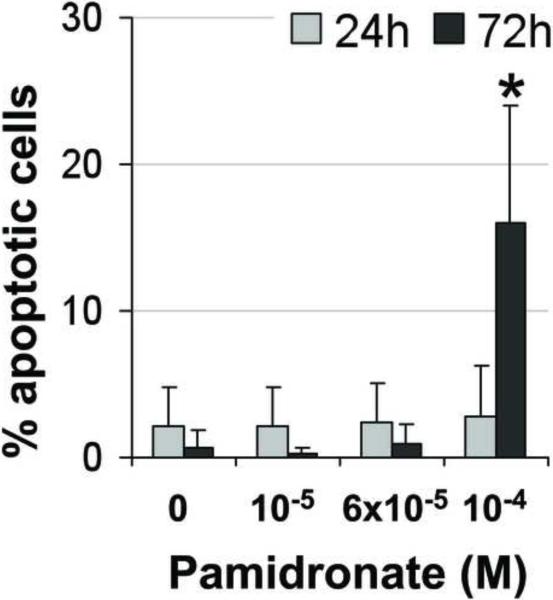
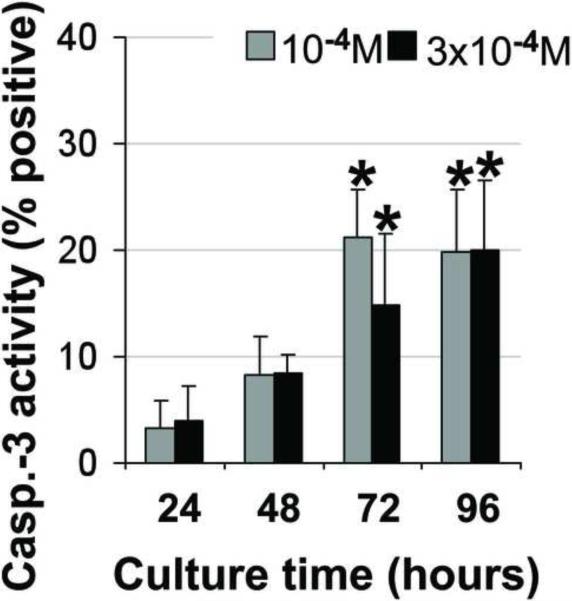
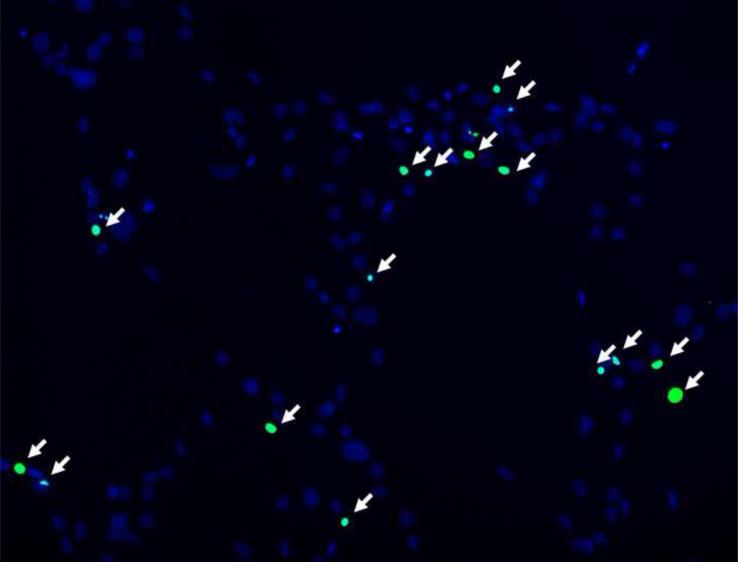
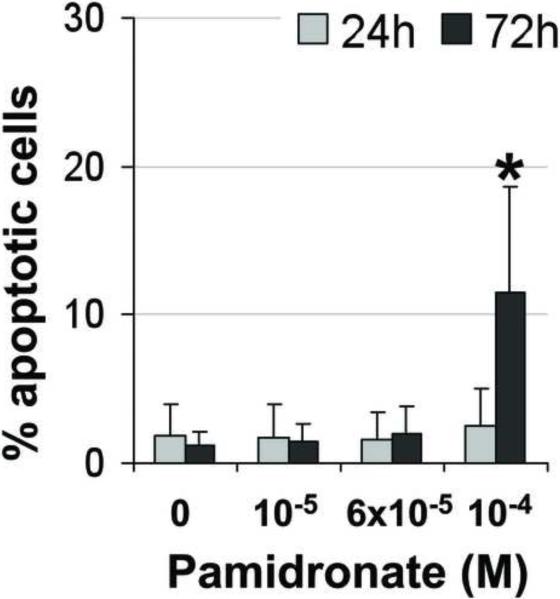
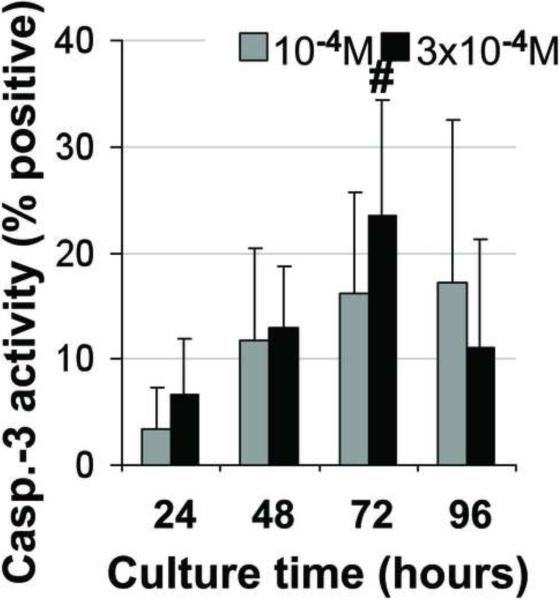
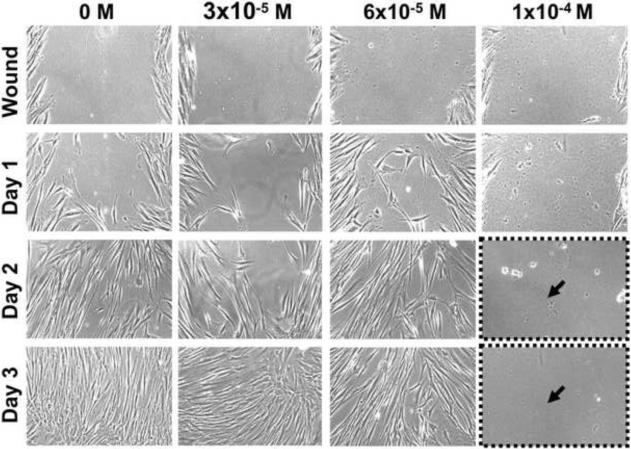
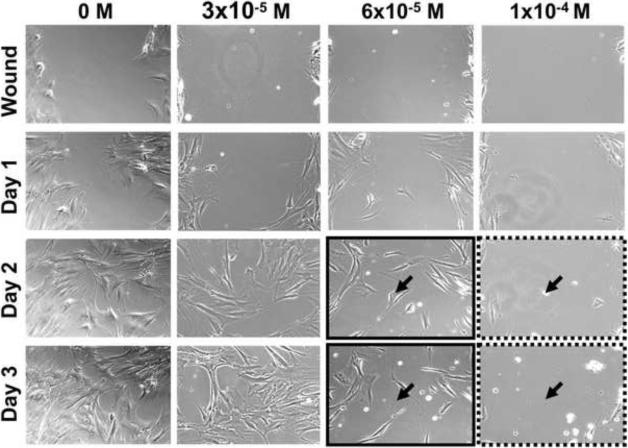
Materials and methods: Primary human osteoblasts and bone marrow stromal cells were isolated from alveolar and iliac/long bone and marrow tissue. Cellular proliferation, alkaline phosphatase activity, apoptosis (terminal deoxynucleotidyl transferase dUTP nick end labeling, caspase-3, and 4,6-diamidino-2-phenylindole dihydrochloride assays) and wound healing in an in vitro scratch assay were assessed after exposure to pamidronate at a range of clinically relevant doses.

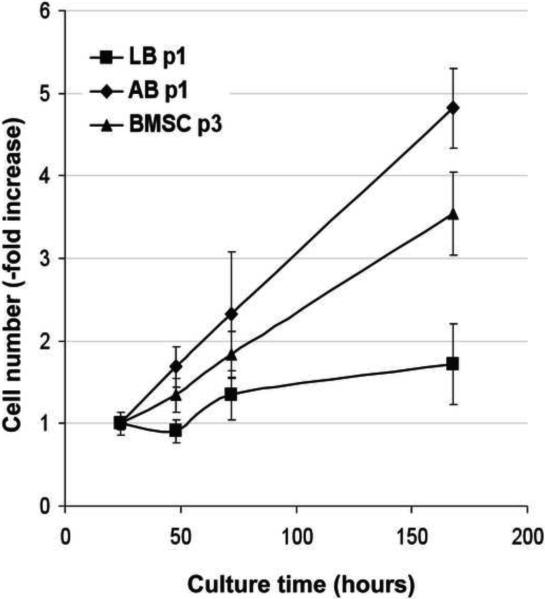
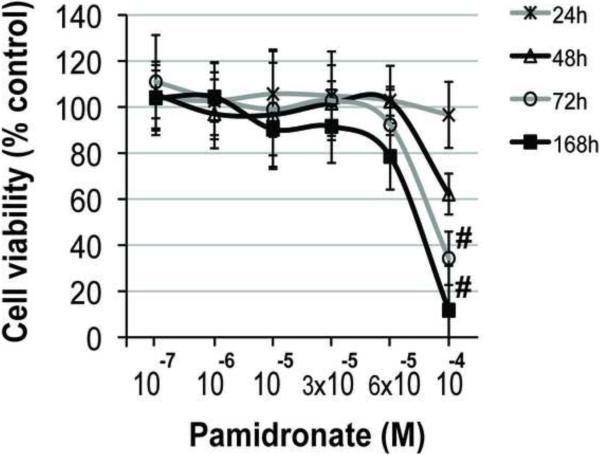
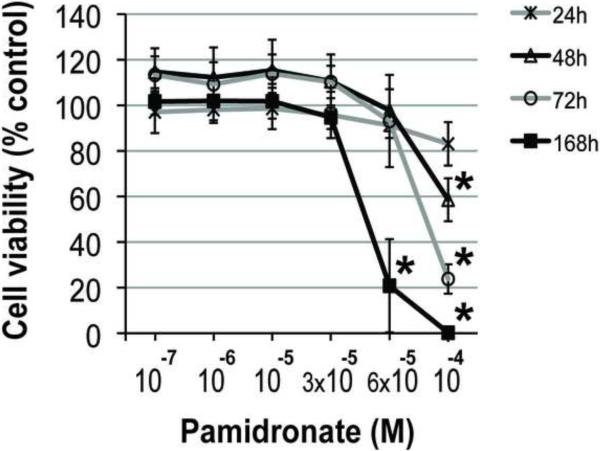
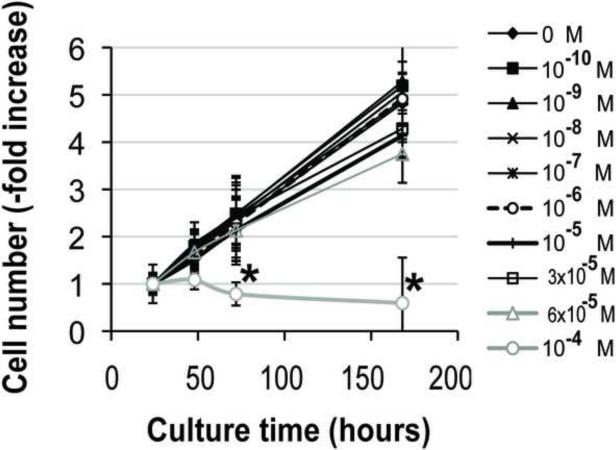
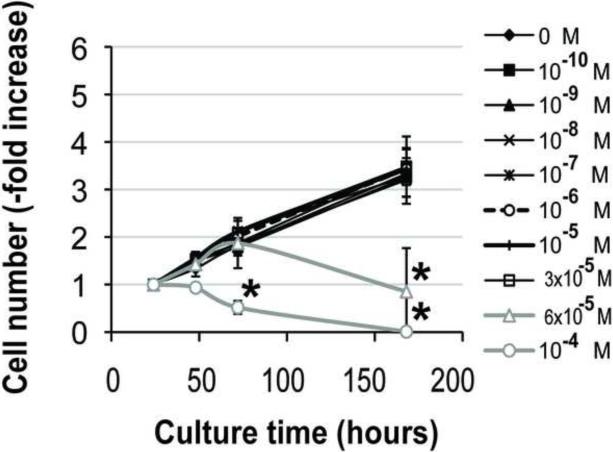
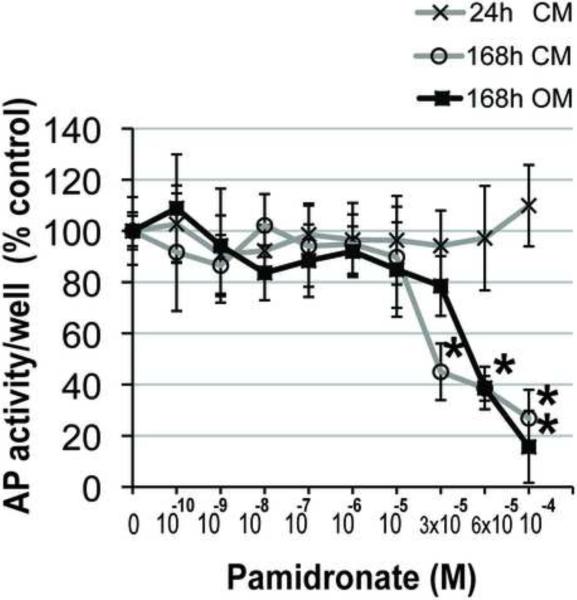
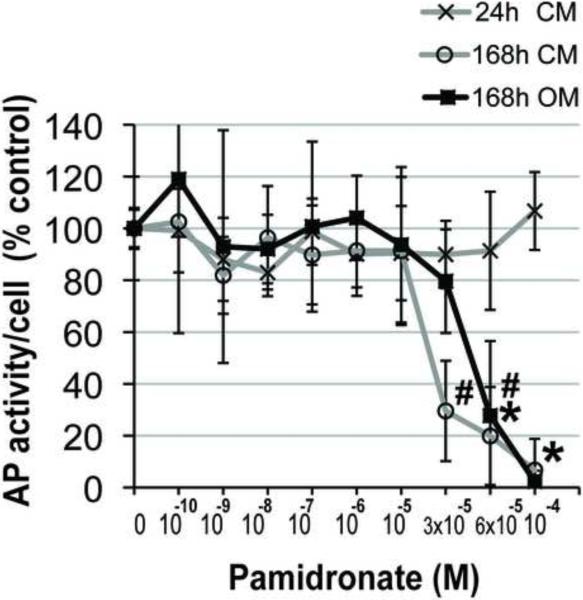
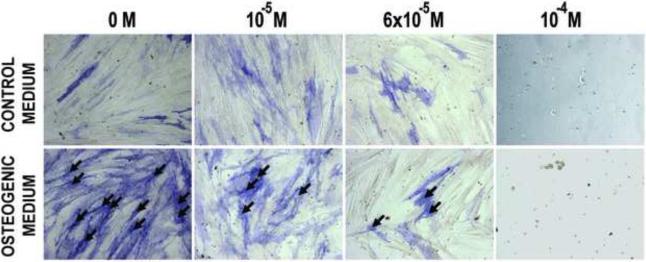
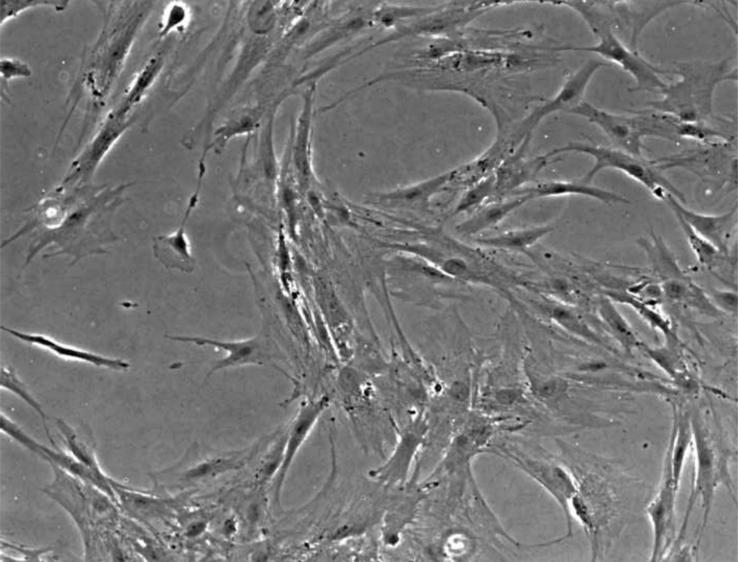
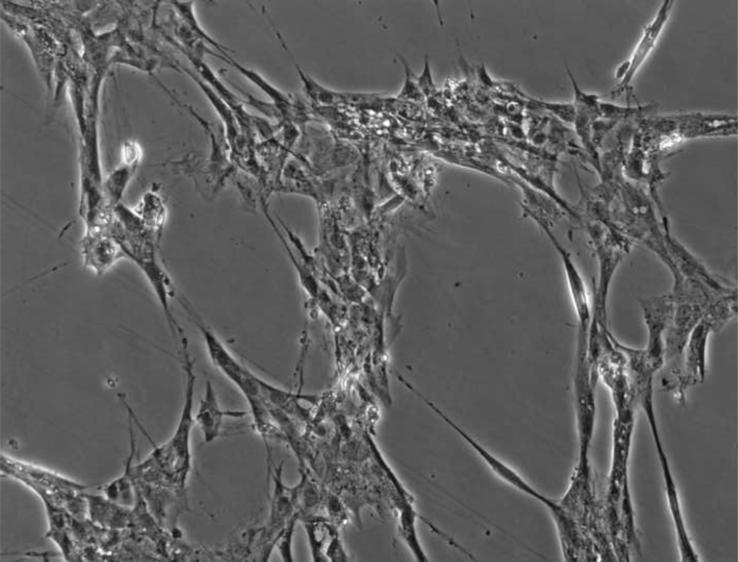
Results: Primary alveolar osteoblasts proliferated at significantly higher rates than long/iliac bone osteoblasts in vitro. Upon exposure of alveolar osteoblasts and long/iliac bone marrow stromal cells to pamidronate for more than 72 hours, we have observed significantly decreased cell viability, proliferation, osteogenesis, and in vitro wound healing at ≥6 × 10(-5) mol/L pamidronate, with the induction of apoptosis in approximately 20% of cell population.

Conclusions: The remodeling activity of alveolar bone, indicated by higher proliferation of alveolar osteoblasts, could be negatively affected by exposure to high concentrations of pamidronate over extended periods. The absence of anabolic effects of pamidronate on alveolar osteoblasts and the induction of apoptosis in osteogenic cells could negatively affect bone balance at this site and contribute to osteonecrosis of the jaw.


Figures

Figure 1
Figure 1. Primary alveolar bone osteoblasts, long bone osteoblasts and BMSCs proliferation
Data represent averages ± SD of measurements (n=4) obtained from four alveolar bone (AB), three iliac/long bone (LB) and three BMSCs samples.
Figure 2
Figure 2. Effects of pamidronate on osteogenic cell viability (A, B) and proliferation (C, D)
High concentrations (≥6 × 10⁻⁵ M) of pamidronate significantly affected survival and decreased cell proliferation of alveolar osteoblasts (A, C) and BMSCs (B, D) in comparison to lower concentration groups (#, p<0.05) (*, p<0.001). Data represent averages ± SD of measurements (n=4) obtained from four alveolar bone and three BMSCs samples.
Figure 3
Figure 3. Effects of pamidronate on alveolar osteoblast osteogenesis
(A, B) Quantitative assessments of AP activity indicated significant decrease at higher pamidronate concentrations (#, p<0.01) (*, p< 0.001). The cells were cultured 168h in unsupplemented medium (CM) and in medium with osteogenic supplements (OM). Data represent averages ± SD of measurements (n=4) obtained from two alveolar bone samples. (C) Histological stains (Fast Blue RR Salt) indicated a decrease in the number of cells strongly expressing AP activity (black arrows) at higher pamidronate concentrations. Magnification 100×.
Figure 4
Figure 4. Induction of apoptosis in alveolar osteoblast (A, B, C, D, E, F) and BMSC (G, H, I, J, K, L) treated cultures
Tunel assay (green stain) indicated the presence of apoptotic cells (white arrows) in the total cell population (blue stain - nuclei) treated with 10−4 M pamidronate (B, H) compared to untreated controls (A, G). Corresponding bright-field images are shown for pamidronate treated (D, J) and untreated cultures (C, I). Magnification 100×. Quantitative assessments of the Tunel slides (E, K) and measurements of caspase-3 activity (F, L) indicated a significant increase in the apoptotic cells after 72h of treatment with 10−4 M pamidronate compared to lower concentrations (*, p< 0.001). A similarly increasing trend with significant increases of caspase-3 activity after 72h was found with three-times higher pamidronate concentration (#, p<0.01) (*, p< 0.001). Data represent averages ± SD of measurements (n=3–4) obtained from three alveolar bone and three BMSCs samples.
Figure 5
Figure 5. Wound healing assay
Alveolar osteoblasts (A) and BMSCs (B) were pretreated with pamidronate for 24h, wounded and continuously monitored over several days. Pamidronate toxicity (black arrows) limited wound healing by BMSCs at 6 × 10⁻⁵ M pamidronate (solid brackets), and completely inhibited wound healing at 10−4 M in both cell types (dotted brackets). Representative images are shown from testing of two alveolar bone and two BMSC samples. Magnification 100×.

Similar articles

Cited by

References

    1. Marx RE, Sawatari Y, Fortin M, et al. Bisphosphonate-induced exposed bone (osteonecrosis/osteopetrosis) of the jaws: risk factors, recognition, prevention, and treatment. J Oral Maxillofac Surg. 2005;63:1567–75. - PubMed
    1. Ruggiero SL, Dodson TB, Assael LA, et al. American Association of Oral and Maxillofacial Surgeons position paper on bisphosphonate-related osteonecrosis of the jaws--2009 update. J Oral Maxillofac Surg. 2009;67:2–12. - PubMed
    1. Khosla S, Burr D, Cauley J, et al. Bisphosphonate-associated osteonecrosis of the jaw: report of a task force of the American Society for Bone and Mineral Research. J Bone Miner Res. 2007;22:1479–91. - PubMed
    1. Kyle RA, Yee GC, Somerfield MR, et al. American Society of Clinical Oncology 2007 clinical practice guideline update on the role of bisphosphonates in multiple myeloma. J Clin Oncol. 2007;25:2464–72. - PubMed
    1. Patel V, McLeod NM, Rogers SN, et al. Bisphosphonate osteonecrosis of the jaw-a literature review of UK policies versus international policies on bisphosphonates, risk factors and prevention. Br J Oral Maxillofac Surg. 2010 - PubMed

Publication types

MeSH terms