

Dual-mode IVUS transducer for image-guided brain therapy: preliminary experiments
- PMID: 21856073
- PMCID: PMC3177008
- DOI: 10.1016/j.ultrasmedbio.2011.06.017
Dual-mode IVUS transducer for image-guided brain therapy: preliminary experiments
Abstract
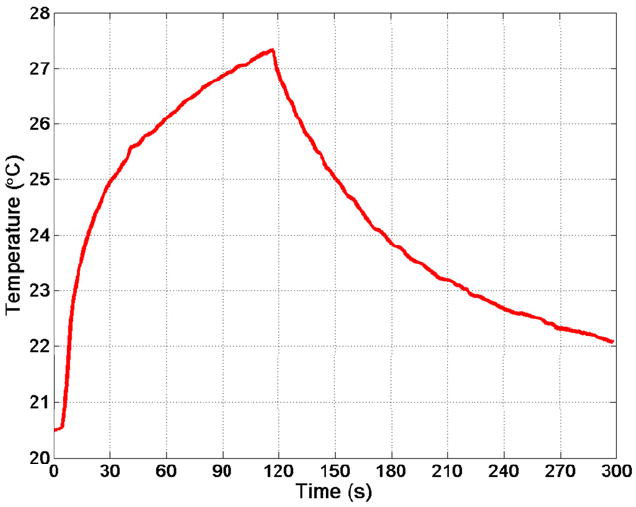
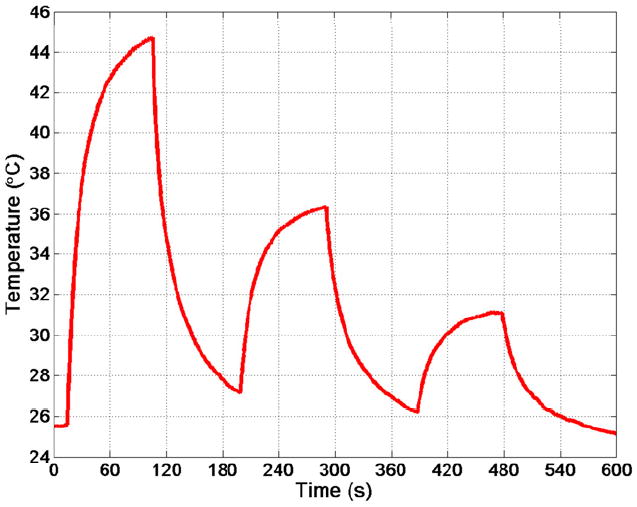
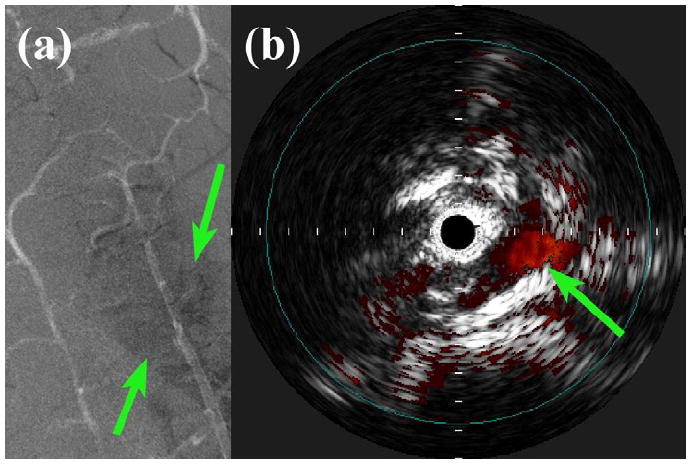
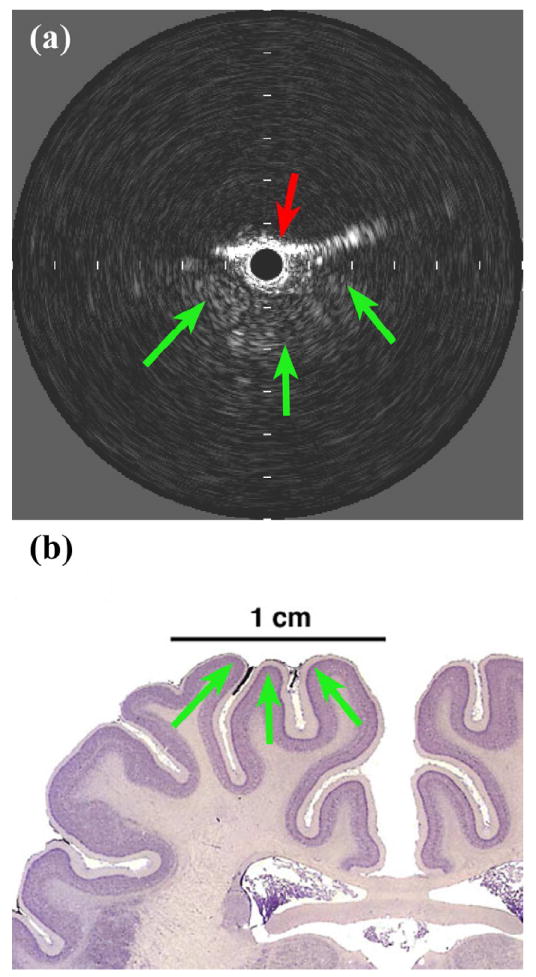
In this study, we investigated the feasibility of using 3.5-Fr intravascular ultrasound (IVUS) catheters for minimally-invasive, image-guided hyperthermia treatment of tumors in the brain. Feasibility was demonstrated by: (1) retro-fitting a commercial 3.5-Fr IVUS catheter with a 5 × 0.5 × 0.22 mm PZT-4 transducer for 9-MHz imaging and (2) testing an identical transducer for therapy potential with 3.3-MHz continuous-wave excitation. The imaging transducer was compared with a 9-Fr, 9-MHz ICE catheter when visualizing the post-mortem ovine brain and was also used to attempt vascular access to an in vivo porcine brain. A net average electrical power input of 700 mW was applied to the therapy transducer, producing a temperature rise of +13.5°C at a depth of 1.5 mm in live brain tumor tissue in the mouse model. These results suggest that it may be feasible to combine the imaging and therapeutic capabilities into a single device as a clinically-viable instrument.
Copyright © 2011 World Federation for Ultrasound in Medicine & Biology. Published by Elsevier Inc. All rights reserved.
Figures

Similar articles
-
Intracranial dual-mode IVUS and hyperthermia using circular arrays: preliminary experiments.Ultrason Imaging. 2013 Jan;35(1):17-29. doi: 10.1177/0161734612469372. Ultrason Imaging. 2013. PMID: 23287504 Free PMC article.
-
Dual-mode IVUS catheter for intracranial image-guided hyperthermia: feasibility study.IEEE Trans Ultrason Ferroelectr Freq Control. 2010 Nov;57(11):2572-84. doi: 10.1109/TUFFC.2010.1723. IEEE Trans Ultrason Ferroelectr Freq Control. 2010. PMID: 21041144 Free PMC article.
-
Dual-mode intracranial catheter integrating 3D ultrasound imaging and hyperthermia for neuro-oncology: feasibility study.Ultrason Imaging. 2009 Apr;31(2):81-100. doi: 10.1177/016173460903100201. Ultrason Imaging. 2009. PMID: 19630251 Free PMC article.
-
Recent Advances in Transducers for Intravascular Ultrasound (IVUS) Imaging.Sensors (Basel). 2021 May 19;21(10):3540. doi: 10.3390/s21103540. Sensors (Basel). 2021. PMID: 34069613 Free PMC article. Review.
-
Mechanically Rotating Intravascular Ultrasound (IVUS) Transducer: A Review.Sensors (Basel). 2021 Jun 5;21(11):3907. doi: 10.3390/s21113907. Sensors (Basel). 2021. PMID: 34198822 Free PMC article. Review.
Cited by
-
Contrast Enhanced Superharmonic Imaging for Acoustic Angiography Using Reduced Form-Factor Lateral Mode Transmitters for Intravascular and Intracavity Applications.IEEE Trans Ultrason Ferroelectr Freq Control. 2017 Feb;64(2):311-319. doi: 10.1109/TUFFC.2016.2619687. Epub 2016 Oct 20. IEEE Trans Ultrason Ferroelectr Freq Control. 2017. PMID: 27775903 Free PMC article.
-
Dual-Frequency Piezoelectric Endoscopic Transducer for Imaging Vascular Invasion in Pancreatic Cancer.IEEE Trans Ultrason Ferroelectr Freq Control. 2017 Jul;64(7):1078-1086. doi: 10.1109/TUFFC.2017.2702010. Epub 2017 May 8. IEEE Trans Ultrason Ferroelectr Freq Control. 2017. PMID: 28489536 Free PMC article.
-
An IVUS transducer for microbubble therapies.IEEE Trans Ultrason Ferroelectr Freq Control. 2014 Mar;61(3):441-9. doi: 10.1109/TUFFC.2014.2929. IEEE Trans Ultrason Ferroelectr Freq Control. 2014. PMID: 24569249 Free PMC article.
-
Localized in vivo model drug delivery with intravascular ultrasound and microbubbles.Ultrasound Med Biol. 2014 Oct;40(10):2458-67. doi: 10.1016/j.ultrasmedbio.2014.04.007. Epub 2014 Aug 15. Ultrasound Med Biol. 2014. PMID: 25130449 Free PMC article.
-
Intravascular ultrasound catheter to enhance microbubble-based drug delivery via acoustic radiation force.IEEE Trans Ultrason Ferroelectr Freq Control. 2012 Oct;59(10):2156-66. doi: 10.1109/TUFFC.2012.2442. IEEE Trans Ultrason Ferroelectr Freq Control. 2012. PMID: 23143566 Free PMC article.
References
-
- ACS. Cancer Facts & Figures 2009. Atlanta: American Cancer Society; 2009. p. 4.
-
- Aubry JF, Tanter M, Pernot M, Thomas JL, Fink M. Experimental demonstration of noninvasive transskull adaptive focusing based on prior computed tomography scans. J Acoust Soc Am. 2003;113:84–93. - PubMed
-
- Bacon DR, Shaw A. Experimental Validation of Predicted Temperature Rises in Tissue-Mimicking Materials. Physics in Medicine and Biology. 1993;38:1647–59. - PubMed
-
- Barthe PG, Slayton MH, Jaeger PM, Makin IRS, Gallagher LA, Mast TD, Runk MM, Faidi W. Ultrasound Therapy System and Ablation Results Utilizing Miniature Imaging/Therapy Arrays. 2004 IEEE Ultrasonics Symposium; Montreal. 2004. pp. 1792–5.
-
- Bernstein M, Berger MS American Association of Neurological Surgeons. Joint Tumor Section., Congress of Neurological Surgeons. Neuro-oncology : the essentials. New York: Thieme Medical Publishers; 2000.
Publication types
MeSH terms
Grants and funding
LinkOut - more resources
Full Text Sources
Other Literature Sources
Medical
