Comparative Study
. 2011 Aug 26;35(2):285-98.
doi: 10.1016/j.immuni.2011.05.017.

Tight regulation of memory CD8(+) T cells limits their effectiveness during sustained high viral load

Affiliations
Comparative Study

Tight regulation of memory CD8(+) T cells limits their effectiveness during sustained high viral load

Erin E West et al. Immunity. .

Abstract

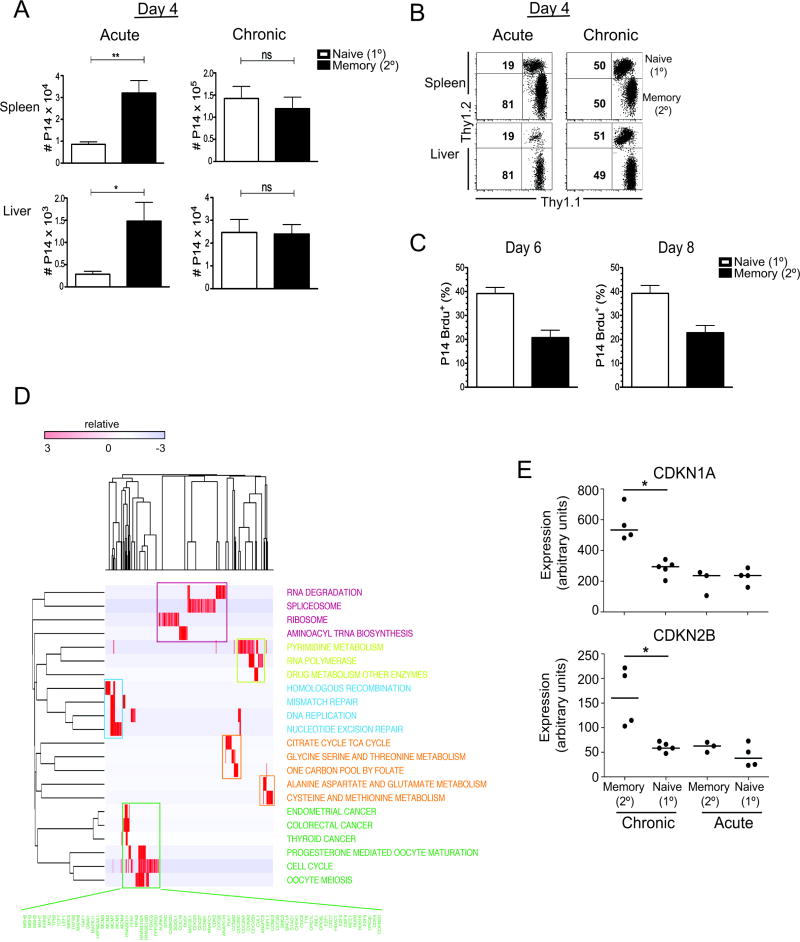
To design successful vaccines for chronic diseases, an understanding of memory CD8(+) T cell responses to persistent antigen restimulation is critical. However, most studies comparing memory and naive cell responses have been performed only in rapidly cleared acute infections. Herein, by comparing the responses of memory and naive CD8(+) T cells to acute and chronic lymphocytic choriomeningitis virus infection, we show that memory cells dominated over naive cells and were protective when present in sufficient numbers to quickly reduce infection. In contrast, when infection was not rapidly reduced, because of high antigen load or persistence, memory cells were quickly lost, unlike naive cells. This loss of memory cells was due to a block in sustaining cell proliferation, selective regulation by the inhibitory receptor 2B4, and increased reliance on CD4(+) T cell help. Thus, emphasizing the importance of designing vaccines that elicit effective CD4(+) T cell help and rapidly control infection.


Figures

Figure 1
Figure 1. Naïve and memory CD8 T cell responses during acute versus chronic infection
1×10³ of each memory (Thy1.1+1.2+) P14 and naïve P14 T cells (Thy1.1+1.2) were co-transferred into naïve B6 mice. On the following day the mice were infected with either LCMV Arm (Acute) or LCMV cl-13 (chronic). Blood was taken at days 7, 14, 21 & 32 post-infection. (A) Percent of transferred memory and naïve P14 cells in the blood after infection. (B and C) Cells were co-transferred as above and mice were infected with either an acute (2×10² pfu) or chronic (2×10⁶ pfu) dose of LCMV cl-13 (B) Representative dot plots and (C) numbers of transferred cells in the tissues day 14 p.i. Results representative of two to six independent experiments with 4–6 mice per group. Statistical comparisons were performed with the unpaired Students t test *p<0.05, **p< 0.01. Error bars represent SEM.
Figure 2
Figure 2. Memory cells are preferentially lost during chronic antigen exposure, regardless of the vaccine or virus used to generate the memory cells
Memory P14’s (Thy1.1+1.2) were generated by either Arm, Ad-5 GP or VV-33 infection. At day 46 p.i. memory cells were sorted based on CD62L expression. Tcm (CD62L+) and Tem (CD62L) cells were each co-transferred with naive P14’s (Thy1.1+1.2+) and the mice were infected the following day with an acute (2×10² pfu) or chronic (2×10⁶ pfu) dose of LCMV cl-13. (A) Experimental set-up. (B) Representative flow plots of Tcm memory and naïve P14 cells in the blood at day 14 p.i. and (C) numbers in the tissues at day 26 p.i. (D) Representative flow plots of Tem memory and naïve P14 cells in the blood at day 14 p.i. and (E) numbers in the tissues at day 26 p.i. Results representative of 6 mice per group. *p<0.05, **p< 0.01, ***p<0.005. Error bars represent SEM.
Figure 3
Figure 3. Initial recruitment of naïve and memory cells is similar during chronic infection, however memory cells have a block in sustaining cell proliferation
(A and B) 5×10³ of each memory (Thy1.1+1.2) and naïve (Thy1.1+1.2+) P14 cells were transferred into B6 mice and the mice were infected the following day with either an acute (2×10² pfu) or chronic (5×10⁶ pfu) dose of LCMV cl-13. (A) Numbers and (B) representative flow plots of naïve and memory P14’s in the spleens and livers at day 4 p.i. (C) 1×10³ of each memory (Thy1.1+1.2) and naïve (Thy1.1+1.2+) P14 cells were transferred into B6 mice and the mice were infected the following day with 2×10⁶ cl-13. Percent of P14 cells that are Brdu+ 6 hours after Brdu i.p. injection at days 6 & 8 p.i. (D) Modular view of genes upregulated in primary vs secondary effectors at day 8 post-chronic infection. Genes upregulated in primary effectors were tested for enrichment with the KEGG collection of annotated gene-sets corresponding to major biological processes using Gene set enrichment analysis (GSEA). The expression of genes contained in the leading edges of gene-sets that were significantly enriched are displayed as a heatmap matrix, and clustered by gene (column) and row (gene-set). A cluster of gene sets related to RNA processing are colored purple; nucleotide synthesis, yellow; DNA replication, blue; metabolism, orange; and proliferation green. Genes contained in the proliferation module are listed in green. (E) Relative gene expression values of CDKNA1 (p21/Cip) (P=0.002) and CDKNB2 (p15) (P=0.002). Results representative of two or three independent experiments with 4–6 mice per group (A–C). *p<0.05, **p< 0.01, ns=p>0.05 (A–C). Error bars represent SEM.
Figure 4
Figure 4. The role of 2B4 in regulating virus-specific memory CD8 T cells during chronic infection
(A and B) Gene set enrichment analysis (GSEA) of a signature of genes associated with exhausted CD8 T cells in the rank ordered list of genes differentially expressed in (A) primary effectors at day 8 in chronic vs. acute infection and (B) secondary effectors at day 8 in chronic vs. acute infection. (C) Genes at the leading edge of enrichment in primary effector GSEA (green set) and secondary effector GSEA (orange set) are largely overlapping. (D) Genes differentially expressed at day 8 in secondary effectors in chronic infection compared to secondary effectors in acute infection and primary effectors in either infection. Each column represents an individual sample, each row a gene and cells colored to indicate relative expression. Top 200 genes upregulated or downregulated are shown, ranked by the signal-to-noise metric, 2B4 (Cd244) is indicated. (E) Relative expression values of Cd244, Tim-3, Lag-3 and PD-1 (F and G) 2×10³ Wild-type (2B4 sufficient) or 2B4-deficient (Cd244−/−) naïve and memory P14’s (all Thy1.1+1.2+) were individually transferred into mice and on the following day the mice were infected with 2×10⁶ pfu cl-13 i.v. (F) Representative flow plots of P14’s in the blood at day 7 p.i. and (G) number of P14 T cells per 106 PBMC at days 7,14 &23 post-infection. Results representative of 12 mice per group (F and G). *p<0.05, **p< 0.01, ***p<0.005 (F and G).
Figure 5
Figure 5. The role of CD4 T cell help in primary and secondary responses during acute versus chronic infection
1×10³ of each memory (Thy1.1+1.2+) and naïve (Thy1.1+1.2) P14’s were co-transferred with or without 1×10⁶ LCMV-GP61 specific CD4 T cells (Smartas) into naïve mice. The next day mice were infected with either an acute (2×10²) or chronic (2×10⁶) dose of LCMV cl-13.(A) Representative dot plot of naïve and memory P14 T cells in the spleen, liver and lung at day 6.5 p.i. (B) Numbers of naïve and memory P14 T cells in the spleen at day 6.5 p.i. (C) Percent of naïve and memory P14 T cells in blood at day 6.5 p.i. (D) Mice were set-up as in A–D and were treated with MR1 antibody or PBS on day −1,0,3 and 6 p.i. Numbers of naïve and memory P14 T cells in spleen at day 6.5 p.i. In the figures and legends, +CD4 help indicates mice receiving Smarta cells, − CD4 help indicates mice that do not receive Smarta cells. Results are representative of two (D) or three (A–C) independent experiments with 4–6 mice per group. ***p<0.005. Error bars represent SEM.
Figure 6
Figure 6. The ability of naïve and memory cells to control LCMV infection
(A and B) 3×10⁴ of memory or naïve P14 T cells were transferred into naïve B6 mice. The next day the mice were infected with 2×10², 2×10⁴, 2×10⁵ or 2×10⁶ pfu of LCMV cl-13 iv. (A) Viral titer in the spleen on days 2, 3 and 5 p.i., as assayed by plaque assay on Vero E6 cells. (B–D) 1×10³, 1×10⁴, 3×10⁴, 1×10⁵ or 2.5×10⁵ naïve or memory Thy1.1+ P14 T cells were transferred into naïve mice. The next day mice were infected with 2×10⁶ pfu of LCMV cl-13 iv. (B) Viral titer in the serum on days 4, and 8 p.i. (C) Representative dot plots of naïve and memory P14 T cells in the PBMC at day 8 p.i. (D) Viral titer in the serum in mice receiving either no cells, or 1×10³ memory or naïve P14 cells on day 14 p.i. Results are representative of 3–6 mice per group per time point. *p<0.05, ***p<.005, ns=p>0.05.

Comment in

References

    1. Ahlers JD, Belyakov IM. Memories that last forever: strategies for optimizing vaccine T-cell memory. Blood. 2010;115:1678–1689. - PMC - PubMed
    1. Ahmed R, Gray D. Immunological memory and protective immunity: understanding their relation. Science. 1996;272:54–60. - PubMed
    1. Ahmed R, Salmi A, Butler LD, Chiller JM, Oldstone MB. Selection of genetic variants of lymphocytic choriomeningitis virus in spleens of persistently infected mice. Role in suppression of cytotoxic T lymphocyte response and viral persistence. J Exp Med. 1984;160:521–540. - PMC - PubMed
    1. Appay V, Douek DC, Price DA. CD8+ T cell efficacy in vaccination and disease. Nat Med. 2008;14:623–628. - PubMed
    1. Badovinac VP, Messingham KA, Hamilton SE, Harty JT. Regulation of CD8+ T cells undergoing primary and secondary responses to infection in the same host. J Immunol. 2003;170:4933–4942. - PubMed

Publication types

MeSH terms

Associated data