. 2011 Oct;5(5):438-53.
doi: 10.1016/j.molonc.2011.07.003. Epub 2011 Jul 26.

Characterization of DOK1, a candidate tumor suppressor gene, in epithelial ovarian cancer

Affiliations

Characterization of DOK1, a candidate tumor suppressor gene, in epithelial ovarian cancer

Pierre-Luc Mercier et al. Mol Oncol. 2011 Oct.

Abstract

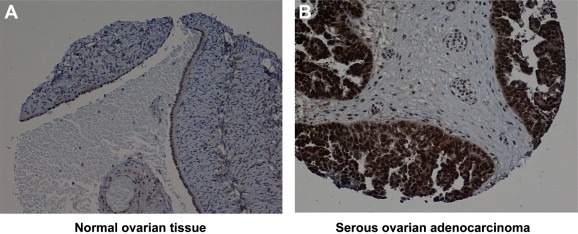
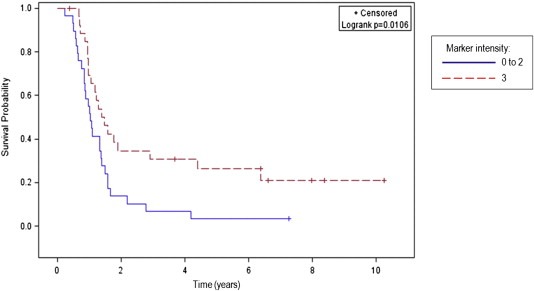
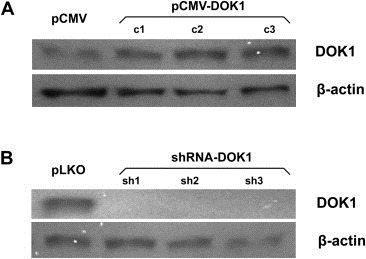
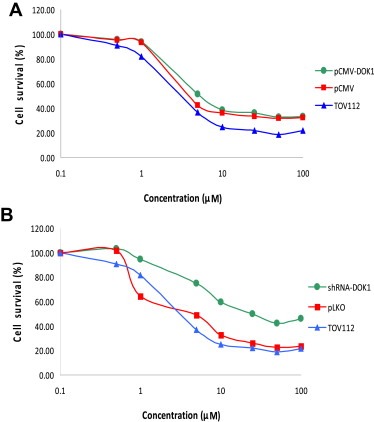
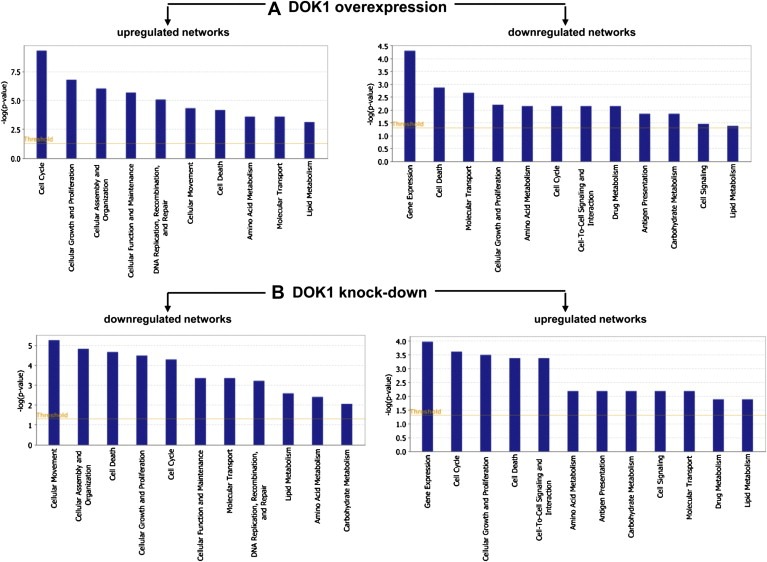
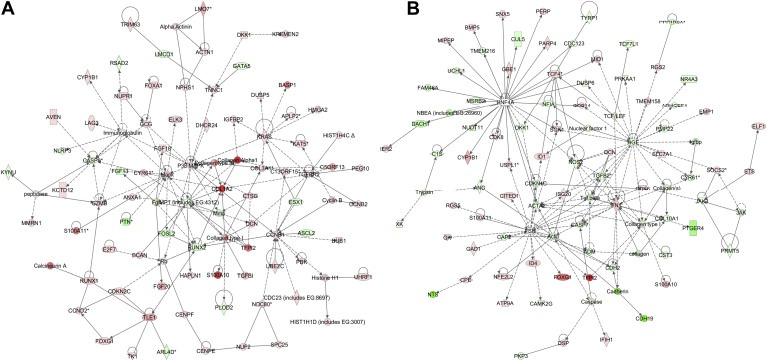
In attempt to discover novel aberrantly hypermethylated genes with putative tumor suppressor function in epithelial ovarian cancer (EOC), we applied expression profiling following pharmacologic inhibition of DNA methylation in EOC cell lines. Among the genes identified, one of particular interest was DOK1, or downstream of tyrosine kinase 1, previously recognized as a candidate tumor suppressor gene (TSG) for leukemia and other human malignancies. Using bisulfite sequencing, we determined that a 5'-non-coding DNA region (located at nt -1158 to -850, upstream of the DOK1 translation start codon) was extensively hypermethylated in primary serous EOC tumors compared with normal ovarian specimens; however, this hypermethylation was not associated with DOK1 suppression. On the contrary, DOK1 was found to be strongly overexpressed in serous EOC tumors as compared to normal tissue and importantly, DOK1 overexpression significantly correlated with improved progression-free survival (PFS) values of serous EOC patients. Ectopic modulation of DOK1 expression in EOC cells and consecutive functional analyses pointed toward association of DOK1 expression with increased EOC cell migration and proliferation, and better sensitivity to cisplatin treatment. Gene expression profiling and consecutive network and pathway analyses were also confirmative for DOK1 association with EOC cell migration and proliferation. These analyses were also indicative for DOK1 protective role in EOC tumorigenesis, linked to DOK1-mediated induction of some tumor suppressor factors and its suppression of pro-metastasis genes. Taken together, our findings are suggestive for a possible tumor suppressor role of DOK1 in EOC; however its implication in enhanced EOC cell migration and proliferation restrain us to conclude that DOK1 represents a true TSG in EOC. Further studies are needed to more completely elucidate the functional implications of DOK1 and other members of the DOK gene family in ovarian tumorigenesis.


Figures

Figure 1
Figure 1
Identification of DOK1 as a potentially hypermethylated gene in EOC cells. A. Semi‐quantitative RT‐PCR validating induction of DOK1 by 5‐aza‐dC treatment in EOC cells. B. BSP DNA methylation analysis of a 308 bp 5′ non‐coding region (nt −1158 to −850) of the DOK1 gene in EOC cells, EOC tumors and normal ovarian tissue samples. Filled circles represent methylated CpGs and open circles represent unmethylated CpGs. CpG plot of the analyzed is also presented (CpGs are indicated with vertical marks).
Figure 2
Figure 2
Representative IHC images of DOK1 protein expression in A, normal ovarian tissue and B, serous ovarian adenocarcinoma.
Figure 3
Figure 3
Kaplan–Meier curve for progression‐free survival according to the level of DOK1 IHC intensity in tumor samples of 57 serous EOC patients.
Figure 4
Figure 4
Western blot analysis of DOK1 expression in TOV112 cells. A. DOK1 expression analysis in DOK1‐overexpressing TOV112 clones pCMV‐DOK1(c1–c3), compared to the mock‐transfected clone pCMV. B. DOK1 expression analysis in DOK1 knockdown TOV112 clones shRNA‐DOK1 (sh1‐sh3), compared to the mock‐transduced clone pLKO. β‐actin was used as a loading control.
Figure 5
Figure 5
Effect of ectopic DOK1 overexpression or shRNA‐mediated DOK1 knockdown on TOV112 cell migration. Migration was assessed by determining the ability of cells to migrate in a culture plate using a wound‐healing assay after 16–24 h of incubation. A. Effect of DOK1 overexpression on TOV112 cell migration. B. Migration profile of the DOK1‐overexpressing TOV112 clone pCMV‐DOK1(c3), compared with a mock‐transfected TOV112 clone (pCMV‐control). C. Effect of DOK1 knockdown on TOV112 cell migration. D. Migration profile of the DOK1 knockdown TOV112 clone shRNA‐DOK1(sh1), compared with a mock‐transduced TOV112 clone (pLKO‐control). ∗Statistical significance, P < 0.05.
Figure 6
Figure 6
Ectopic alteration of DOK1 expression in TOV112 cells: effect on cell proliferation (colony formation assay). A. Representative images of colony forming assays following DOK1 overexpression. B. Representative images of colony forming assays following DOK1 knockdown. C. Colony formation assay showed a significant increase of colony number in DOK1 stably transfected TOV112 cells, compared to mock‐transfected cells. D. shRNA‐mediated DOK1 knockdown significantly decreased colony number in TOV112 cells, compared to cells, transduced with empty vector. Colonies were counted and colony numbers represent mean of 3 repeats for each clone. Standard deviations are indicated by error bars. ∗Statistical significance, P < 0.05.
Figure 7
Figure 7
Dose–response cytotoxicity curves upon cisplatin treatment of TOV112 cells following ectopic DOK1 overexpression or shRNA‐mediated DOK1 knockdown. A. Dose–response cytotoxicity curves upon cisplatin treatment of the DOK1‐overexpressing TOV112 clone pCMV‐DOK1(c3). B. Dose–response cytotoxicity curves upon cisplatin treatment of the DOK1 knockdown TOV112 clone shRNA‐DOK1(sh1). Mock transfected/transduced clones and non‐treated TOV112 cells were used as controls. Dose range for cisplatin was 0.05–100 μM. All results were expressed as mean ± SD of three‐independent experiments.
Figure 8
Figure 8
Functional analysis for a dataset of differentially expressed genes (≥2‐fold) following DOK1 overexpression and suppression in TOV112 cells. A. Functional analysis of up‐ and down‐regulated genes in TOV21 cells following DOK1 overexpression. B. Functional analysis of up‐ and down‐regulated genes in TOV21 cells following DOK1 suppression. Top functions that meet a p‐value cutoff of 0.05 are displayed.
Figure 9
Figure 9
Network analysis of dynamic gene expression in TOV112 cells based on the 2‐fold common gene expression list obtained following ectopic DOK1 overexpression or shRNA‐mediated DOK1 knockdown. A. Network analysis of DOK1‐overexpressing TOV112 cells; B. Network analysis of TOV112 cells following DOK1 suppression. The five top‐scoring networks for each cell line were merged and are displayed graphically as nodes (genes/gene products) and edges (the biological relationships between the nodes). Intensity of the node color indicates the degree of up‐ (red) or downregulation (green). Nodes are displayed using various shapes that represent the functional class of the gene product (square, cytokine, vertical oval, transmembrane receptor, rectangle, nuclear receptor, diamond, enzyme, rhomboid, transporter, hexagon, translation factor, horizontal oval, transcription factor, circle, other). Edges are displayed with various labels that describe the nature of relationship between the nodes: binding only, → acts on. The length of an edge reflects the evidence supporting that node‐to‐node relationship, in that edges supported by article from literature are shorter. Dotted edges represent indirect interaction.

References

    1. Babuin, L. , Jaffe, A.S. , 2005. Troponin: the biomarker of choice for the detection of cardiac injury. Canadian Medical Association Journal. 173, 1191–1202. - PMC - PubMed
    1. Bachvarov, D. , L'Esperance, S. , Popa, I. , Bachvarova, M. , Plante, M. , Tetu, B. , 2006. Gene expression patterns of chemoresistant and chemosensitive serous epithelial ovarian tumors with possible predictive value in response to initial chemotherapy. International Journal of Oncology. 29, 919–933. - PubMed
    1. Balch, C. , Huang, T.H. , Brown, R. , Nephew, K.P. , 2004. The epigenetics of ovarian cancer drug resistance and resensitization. American Journal of Obstetrics and Gynecology. 191, 1552–1572. - PubMed
    1. Bartling, B. , Desole, M. , Rohrbach, S. , Silber, R.E. , Simm, A. , 2009. Age-associated changes of extracellular matrix collagen impair lung cancer cell migration. Faseb Journal. 23, 1510–1520. - PubMed
    1. Barton, C.A. , Hacker, N.F. , Clark, S.J. , O'Brien, P.M. , 2008. DNA methylation changes in ovarian cancer: implications for early diagnosis, prognosis and treatment. Gynecologic Oncology. 109, 129–139. - PubMed

Publication types

MeSH terms