. 2011 Nov 1;51(9):1686-96.
doi: 10.1016/j.freeradbiomed.2011.07.024. Epub 2011 Aug 5.

Inhibition of aldose reductase prevents endotoxin-induced inflammation by regulating the arachidonic acid pathway in murine macrophages

Affiliations

Inhibition of aldose reductase prevents endotoxin-induced inflammation by regulating the arachidonic acid pathway in murine macrophages

Mohammad Shoeb et al. Free Radic Biol Med. .

Abstract

The bacterial endotoxin lipopolysaccharide (LPS) is known to induce release of arachidonic acid (AA) and its metabolic products, which play important roles in the inflammatory process. We have shown earlier that LPS-induced signals in macrophages are mediated by aldose reductase (AR). Here we have investigated the role of AR in LPS-induced release of AA metabolites and their modulation using a potent pharmacological inhibitor, fidarestat, and AR siRNA ablation in RAW264.7 macrophages and AR-knockout mouse peritoneal macrophages and heart tissue. Inhibition or genetic ablation of AR prevented the LPS-induced synthesis and release of AA metabolites such as PGE2, TXB, PGI2, and LTBs in macrophages. LPS-induced activation of cPLA2 was also prevented by AR inhibition. Similarly, AR inhibition also prevented the calcium ionophore A23187-induced cPLA2 and LTB4 in macrophages. Further, AR inhibition by fidarestat prevented the expression of AA-metabolizing enzymes such as COX-2 and LOX-5 in RAW264.7 cells and AR-knockout mouse-derived peritoneal macrophages. LPS-induced expression of AA-metabolizing enzymes and their catalyzed metabolic products was significantly lower in peritoneal macrophages and heart tissue from AR-knockout mice. LPS-induced activation of redox-sensitive signaling intermediates such as MAPKs, transcription factor NF-κB, and EGR-1, a transcriptional regulator of mPGES-1, which in collaboration with COX-2 leads to the production of PGE2, was also significantly prevented by AR inhibition. Taken together, our results indicate that AR mediates LPS-induced inflammation by regulating the AA-metabolic pathway and thus provide a novel role for AR inhibition in preventing inflammatory complications such as sepsis.


Figures

Figure 1
Figure 1
AR inhibition prevents the release of arachidonic acid (AA) metabolites from LPS-stimulated RAW264.7 cells. The RAW254.7 cells were incubated with 3H-AA (0.1 μCi/ml) as described in methods and stimulated with 1 μg/ml LPS for 1 h. The cells were washed and incubated for 18 h in fresh medium containing AR inhibitor (10 μM). The release of metabolites in the medium was determined by measuring the radioactivity in the culture medium. Data represents mean ± S.E. (n=4). #p <0.001 as compared with AA alone, **p<0.001 as compared with AA+LPS-treated cells; AA; Arachidonic acid, Fida; Fidarestat
Figure 2
Figure 2
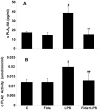
AR inhibition prevents LPS-induced production of sPLA2 and cPLA2 in RAW264.7 macrophages. (A & B) The RAW cells were growth-arrested in medium containing 0.1% serum without or with AR inhibitor (10 μM) as indicated and challenged with LPS for 18 h. The sPLA2 levels in the culture medium of RAW cells were determined by using the monoclonal enzyme immunoassay kit as described in methods. (B) The cPLA2 levels in cell homogenate were determined by using the monoclonal enzyme immunoassay kit as described in methods. Data represents mean ± S.E. (n=4). # p<0.001 Vs control; ** p <0.001 Vs LPS treated cells; $ p<0.01 Vs control cells; ## p <0.01 Vs. LPS-treated cells.
Figure 3
Figure 3
Effect of AR inhibition on LPS-induced production of PGE2, TXB2, 6k-PGF1α and LTB4 in RAW264.7 macrophages. The RAW cells were growth-arrested in Dulbecco’s modified Eagle’s medium containing 0.1% serum with or without AR inhibitor (10 μM) and challenged with LPS for 18 h. (A-D) The levels of PGE2, TXB2, 6k-PGF1α and LTB4 were determined in the culture medium by using the monoclonal enzyme immunoassay kits as described in methods. Data represents mean ± S.E. (n=4). # p<0.001 Vs control cells; ** p <0.001 Vs LPS-treated cells, $ p<0.05 Vs control cells; ## p <0.05 Vs LPS-treated cells. C; Control, Fida; Fidarestat, L; LPS, Sc; Scrambled SiRNA, siAR; AR siRNA, AR; Aldose reductase.
Figure 4
Figure 4
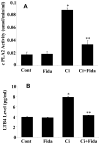
Effect of AR inhibition on calcium ionophore A23187-induced release of cPLA2 and LTB4 in RAW264.7 macrophages. The RAW cells were growth-arrested overnight in medium containing 0.1% serum without or with AR inhibitor (10 μM). Subsequently macrophages were challenged with 1 μM calcium ionophore A23187 for 1 h. The levels of cPLA2 and LTB4 were measured in the cell homogenates and culture media by using monoclonal enzyme immunoassay kits. Data represents mean ± S.E. (n=4). *p<0.001 Vs control; ** p <0.001 Vs A23187-treated cells; C; Control, Fida; Fidarestat.
Figure 5
Figure 5
AR inhibition prevents LPS-induced expression of COX2 and TXB synthase, PGI2 synthase and LOX-5 in RAW cells. The RAW cells were growth-arrested by incubating in 0.1% FBS medium without or with AR inhibitor, fidarestat (10 μM), and stimulated with LPS (1 μg/ml) for 24 h. Cytosolic extracts were prepared and equal amounts of cytosolic proteins were subjected to Western blot analysis using antibodies against (A) COX-2, (B) TXB synthase (C) PGI2 synthase (D) LOX-5 and (E) β-Actin. A representative blot from each group is shown. Data represents mean ± S.E. (n=3). # p<0.001 Vs control; ** p <0.001 Vs LPS treated cells. Cont; Control and Fida; Fidarestat.
Figure 6
Figure 6
Effect of AR inhibition on LPS-induced COX2 and TXB synthase, and LOX-5 gene mRNA expression in RAW cells. Cells were growth-arrested in Dulbecco’s modified Eagle’s medium containing 0.1% serum with or without the indicated AR inhibitors (10 μM) and challenged with LPS (1 μg/ml). The total RNA was isolated and reverse transcriptase-PCR analysis was carried out using specific primers for COX-2, TXB synthase and LOX-5. Equal amount of PCR products were electrophoresed with 1% agarose-TAE gels containing ethidium bromide. Reverse transcriptase- PCR analysis with GADPH served as control. Data represents mean ± S.E. (n=3). # p<0.001 Vs control; ** p <0.001 Vs LPS treated cells. Cont; Control and Fida; Fidarestat.
Figure 7
Figure 7
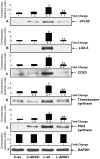
Peritoneal macrophages isolated from AR null mice are resistant to LPS-stimulated release of AA metabolites. (A) Peritoneal macrophages isolated from mice peritoneum were incubated with (0.1 μCi/ml) 3H-AA with/or without LPS for 12 h at 37°C. The release of AA metabolites was determined by measuring the radioactivity in the culture medium. (B) The peritoneal macrophages were lysed in RIPA lysis buffer and equal amount of proteins were subjected to Western blot analysis using antibodies against (a) cPLA2, (b) LOX-5, (c) COX-2, (d) Thromboxane synthase, (e) PGI2 synthase and (f) GAPDH. Representative blots are shown (n = 3). Data represents mean ± S.E. (n=3). #p<0.001 Vs control wild type cells; ** p <0.0001 Vs LPS treated wild type cells. C-wt; control wild type, C-ARKO; control-aldose reductase knockout, L-wt; LPS treated wild type, L-ARKO; LPS treated-aldose reductase knockout.
Figure 8
Figure 8
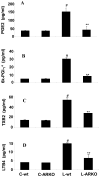
Peritoneal macrophages isolated from AR null mice are resistant to LPS-stimulated production of inflammatory lipid mediators. LPS-induced peritoneal macrophages isolated from AR knockout mice peritoneum were growth-arrested in RPMI-1640 containing 0.1% serum for 24h. The levels of PGE2, 6k-PGF1α, TXB2, and LTB4 were determined in the culture media using the monoclonal enzyme immunoassay kits as described in methods. Data represents mean ± S.E. (n=4). # p<0.001 Vs control wild type cells; ** p <0.001 Vs LPS treated wild type cells. C-wt; control wild type, C-ARKO; control-aldose reductase knockout, L-wt; LPS treated wild type, L-ARKO; LPS treated-aldose reductase knockout.
Figure 9
Figure 9
Decreased expression of AA pathway enzymes in the hearts of LPS-treated AR null mice. The ARKO and WT mice were injected (i.p) with LPS and after 24 h heart tissues were dissected out. Equal amount of proteins from mice heart homogenates were analyzed by Western blotting using antibodies against (A) cPLA2, (B) LOX-5, (C) COX-2, (D) Thromboxane synthase, (E) PGI2 synthase and (F) GAPDH. Representative blots are shown. Data represents mean ± S.E. (n=3). # p<0.001 Vs control; ** p <0.001 Vs LPS treated cells. C-wt; control wild type, C-ARKO; control-aldose reductase knockout, L-wt; LPS treated wild type, L-ARKO; LPS treated-aldose reductase knockout.
Figure 10
Figure 10
Effect of inhibitors of AR, COX-2 and LOX-5 on LPS-induced macrophage viability and monocyte adhesion to endothelial cells. (A) Growth-arrested macrophages were preincubated in the presence or absence of AR inhibitor fidarestat (10 μM), COX-2 inhibitor indomethacin (10 μM) and LOX-5 inhibitor REV 5901 (10 μM) for 24 h at 370C. Cell viability was determined by trypan blue exclusion method. (B) Serum-starved HUVECs cells were preincubated without or with fidarestat, indomethacin and REV 5901 for 24 h, followed by stimulation with LPS (1 μg/ml) for another 24 h. After incubations, the cells were washed with PBS, U-937 cells were added, and the incubation continued for another 12 h. Cell adhesion was determined by MTT assay. Data represents mean ± S.E. (n=4). #p<0.001 Vs control; **p <0.001 Vs LPS-treated cells.
Figure 11
Figure 11
Effect of AR inhibition LPS-induced p38, ERK1/2 and p65 phosphorylation in macrophages. Growth-arrested macrophages were treated with LPS without and with fidarestat (10 μM) for indicated time at 37°C. Cell lysate was prepared and equal amount of protein was subjected to western blot analysis using antibodies against A. phospho p38 and p38 B. phospho pERK1/2 and ERK1/2, C.EGR-1, D. phospho p65 and p65 and E. GAPDG. Data represents mean ± S.E. (n=3). # p<0.001 Vs control; ** p <0.001 Vs LPS treated cells.
Figure 12
Figure 12
AR inhibition up-regulates LPS-induced expression of Nrf2, HO-1 and GCLC, and activity of GST in macrophages. Macrophages were growth-arrested by incubation in 0.1% FBS medium without or with AR inhibitor, fidarestat (10 μM) for 12 h followed by stimulation with LPS (1 μg/ml). (A) At indicated time points, nuclear and whole cell extracts were prepared. Nuclear proteins were separated by SDS-PAGE, and western blot analysis was conducted using Nrf2 antibodies. (B) At 12 and 24 h, equal amounts of whole cell extracts were subjected to Western blot analysis using antibodies against HO-1 and GCLC and the blots were stripped and reprobed with loading control GAPDH. (C) At 24 h, total GST activity was measured using CDNB as substrate as described in methods. Data represents mean ± S.E. (n=3). *p<0.01 and ** p <0.001 Vs untreated cells.

Similar articles

Cited by

References

    1. Mayer RJ, Marshall LA. New insights on mammalian phospholipase A2(s); comparison of arachidonoyl-selective and -nonselective enzymes. FASEB J. 1993;7:339–348. - PubMed
    1. Dermott JM, Reddy MR, Onesime D, Reddy EP, Dhanasekaran N. Oncogenic mutant of Galpha12 stimulates cell proliferation through cycloxygenase-2 signaling pathway. Oncogene. 1999;18:7185–7189. - PubMed
    1. Leslie CC. Properties and regulation of cytosolic phospholipase A2. J BiolChem. 1997;272:16709–16712. - PubMed
    1. Reuter S, Gupta SC, Chaturvedi MM, Aggarwal BB. Oxidative stress, inflammation, and cancer: how are they linked? Free Radic Biol Med. 2010;49:1603–16. - PMC - PubMed
    1. Okamoto F, Saeki K, Sumimoto H, Yamasaki S, Yokomizo T. Leukotriene B4 augments and restores Fc gammaRs-dependent phagocytosis in macrophages. J Biol Chem. 2010;285:41113–41121. - PMC - PubMed

Publication types