. 2011 Aug;23(8):2950-63.
doi: 10.1105/tpc.111.087973. Epub 2011 Aug 19.

The chloroplast calcium sensor CAS is required for photoacclimation in Chlamydomonas reinhardtii

Affiliations

The chloroplast calcium sensor CAS is required for photoacclimation in Chlamydomonas reinhardtii

Dimitris Petroutsos et al. Plant Cell. 2011 Aug.

Abstract

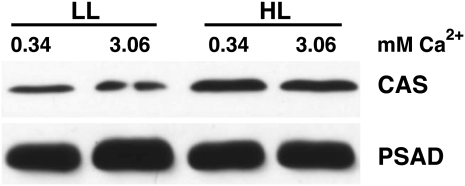
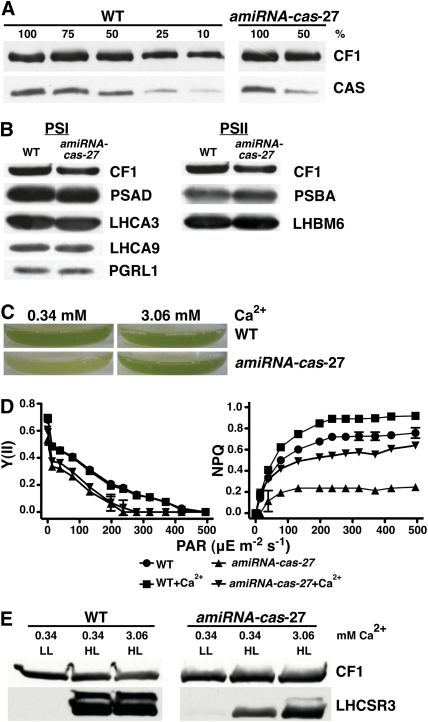
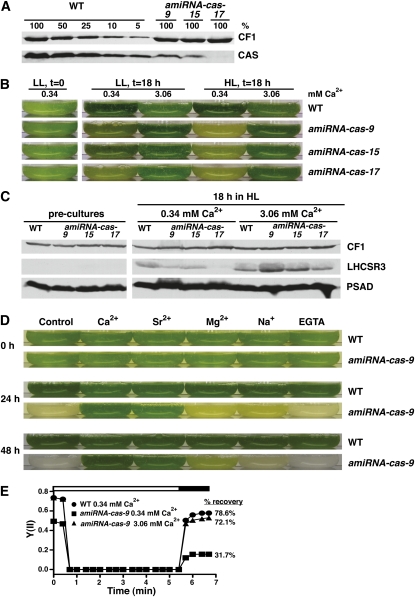
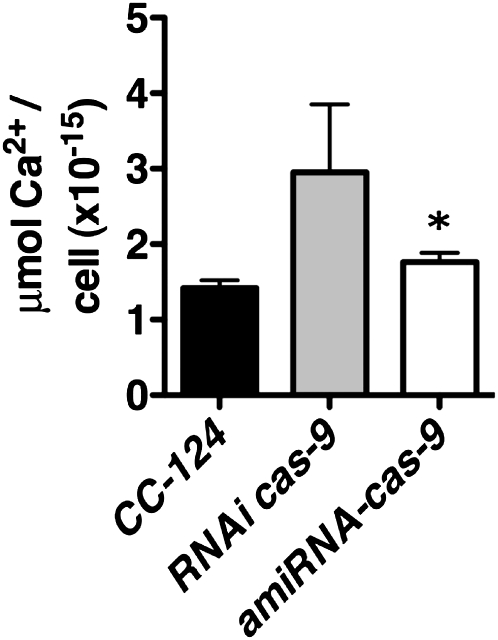
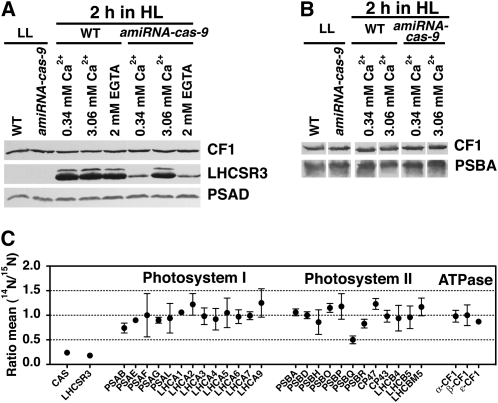
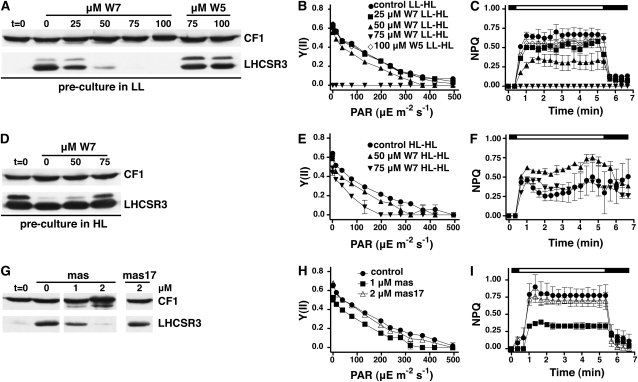
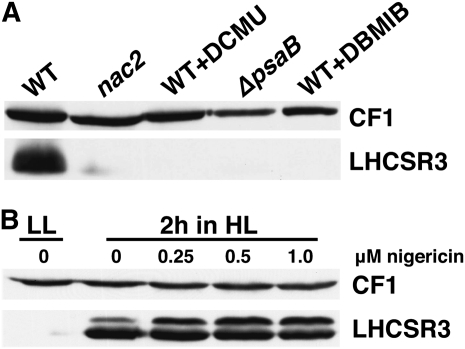
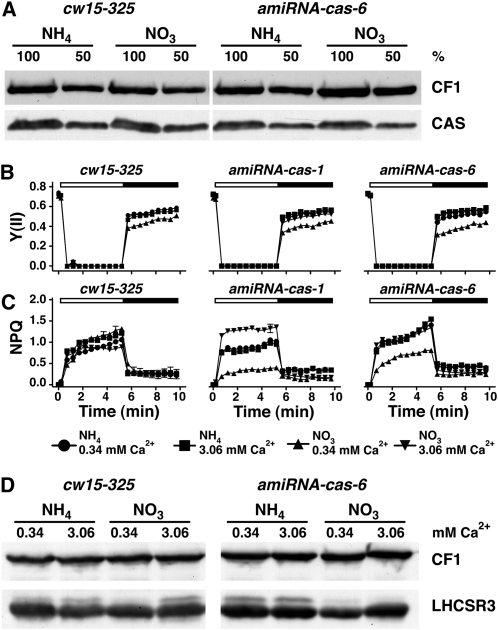
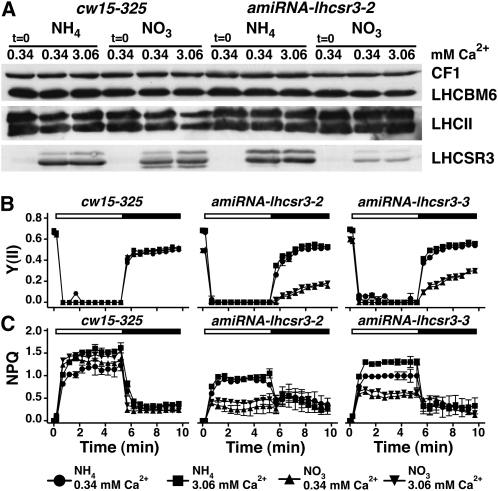
The plant-specific calcium binding protein CAS (calcium sensor) has been localized in chloroplast thylakoid membranes of vascular plants and green algae. To elucidate the function of CAS in Chlamydomonas reinhardtii, we generated and analyzed eight independent CAS knockdown C. reinhardtii lines (cas-kd). Upon transfer to high-light (HL) growth conditions, cas-kd lines were unable to properly induce the expression of LHCSR3 protein that is crucial for nonphotochemical quenching. Prolonged exposure to HL revealed a severe light sensitivity of cas-kd lines and caused diminished activity and recovery of photosystem II (PSII). Remarkably, the induction of LHCSR3, the growth of cas-kd lines under HL, and the performance of PSII were fully rescued by increasing the calcium concentration in the growth media. Moreover, perturbing cellular Ca(2+) homeostasis by application of the calmodulin antagonist W7 or the G-protein activator mastoparan impaired the induction of LHCSR3 expression in a concentration-dependent manner. Our findings demonstrate that CAS and Ca(2+) are critically involved in the regulation of the HL response and particularly in the control of LHCSR3 expression.


Figures

Figure 1.
Figure 1.
CAS Protein Expression Is Enhanced in HL. Quantification of CAS amounts in thylakoids isolated from LL- and HL-treated wild-type (CC-124) cells upon SDS-PAGE fractionation and immunoblot analysis (5 μg of chlorophyll per lane; PSAD served as the loading control). Cells were grown in HSM and LL and were shifted to HL for 24 h in HSM medium containing the indicated amount of Ca2+ in the form of its chloride salt. Starting cell density of the cultures was 1 × 10⁶ cells/mL. Densitometric analyses of the CAS and PSAD signals showed that CAS is twofold upregulated in HL.
Figure 2.
Figure 2.
Knockdown of CAS Leads to Light Sensitivity and to Decreased NPQ Induction and LHCSR3 Expression. (A) Quantification of CAS amounts in thylakoids isolated from the wild type (WT; cw15-arg7) and amiRNA-cas-27. Cells were grown in TAP under LL upon SDS-PAGE fractionation and immunoblot analysis (100% equals 4 μg of chlorophyll per lane; CF1 served as the loading control). (B) Quantification of PSI and PSII subunits in the wild type (cw15-arg7) and amiRNA-cas-27 grown in TAP under LL. Four micrograms of chlorophyll of whole-cell extracts was fractionated on a 13% SDS-PAGE, and several protein abundance were analyzed by immunoblots. PSI-related proteins: PSAD, LHCA3, LHCA9, and PGRL1; PSII-related proteins: PSBA and LHCBM6; loading control: CF1. (C) Growth phenotype of the wild type (cw15-arg7) and cas-kd strain amiRNA-cas-27 after 18 h under HL. Cells were grown in 80% HSM containing the indicated amount of Ca2+ in the form of its chloride salt. Starting cell density of the cultures was 1 × 10⁶ cells/mL. The picture shows the bottom of Erlenmeyer flasks containing the cell cultures. (D) Irradiance dependence of quantum yield of PSII (YII) and of NPQ in the wild type (cw15arg7) and amiRNA-cas-27. Cells were grown in TAP under LL and then exposed for 2 h under HL in 80% HSM. Values plotted are the means of three samples ± sd. (E) Quantification of LHCSR3 amounts in the wild type (cw15-arg7) and amiRNA-cas-27. Cells were grown in TAP under LL and then shifted for 2 h to HL (200 μE m−2 s−1) in 80% HSM containing 0.34 or 3.06 mM CaCl2 concentration. Five micrograms of chlorophyll of whole-cell extracts was fractionated on a 13% SDS-PAGE, and LHCSR3 abundance was analyzed by immunoblots. CF1 signal served as a loading control.
Figure 3.
Figure 3.
Three Additional CAS Knockdown Lines Confirm the amiRNA-cas-27 HL Growth Phenotype and the Impact on LHCSR3 Expression. (A) Quantification of CAS amounts in thylakoids isolated from the wild type (WT; CC-124) and amiRNA-cas-9, -15, and -17. Cells were grown in TAP under LL and analyzed by SDS-PAGE fractionation and immunoblotting (100% equals 10 μg of chlorophyll per lane; CF1 signal served as loading control). (B) Growth phenotype of wild-type (CC-124) and cas knockdown strains (amiRNA-cas-9, -15, and -17) after an 18-h shift from LL TAP to LL or HL 80% HSM containing 0.34 or 3.06 mM CaCl2. Starting cell density of the cultures was 1 × 10⁶ cells/mL. The picture shows the bottom of Erlenmeyer flasks containing the cell cultures. (C) Quantification of LHCSR3 in wild-type (CC-124) and cas knockdown strains. Five micrograms of chlorophyll of whole-cell extracts derived from the experiment of Figure 3B were fractionated on a 13% SDS-PAGE and PSAD, and LHCSR3 and CF1 abundance was analyzed by immunoblots. CF1 signal served as a loading control. (D) Growth phenotype of the wild type (CC-124) and amiRNA-cas-9 24 and 48 h after being shifted from LL TAP to HL 80% HSM with the addition either of the indicated ions in their chloride salt form (final concentration 3.06 mM) or of EGTA (2 mM). Control contained 0.34 mM Ca2+, 0.41 mM Mg2+, and 0.27 mM Na+. Starting cell density of the cultures was 1 × 10⁶ cells/mL. (E) Recovery of PSII activity in wild-type and amiRNA-cas-9 cells. amiRNA-cas-9 cells were grown for 16 h under LL in HSM medium containing the indicated amounts of Ca2+. Cells were then dark adapted for 20 min, and the recovery of their PSII activity was recorded during a short dark period (black bar), which followed a 5-min light period of 800 μE m−2 s−1 (white bar). Values plotted are the means of three measurements ± sd of single biological samples of a representative experiment.
Figure 4.
Figure 4.
Downregulation of CAS Does Not Lead to Decrease in Cellular Calcium Content. Calcium content of the cas-kd strains RNAi-cas-9 (gray bar) and amiRNA-cas-9 (white bar) compared with their wild-type background CC-124 (black bar) as assessed by atomic absorption spectroscopy. Data are presented on a per cell basis. The values are the means ± sd of three biological samples. The asterisk indicates statistically significant difference from wild-type levels (paired t test, 95% confidence level).
Figure 5.
Figure 5.
LHCSR3 Induction Is Strongly Reduced in amiRNA-cas-9, While Photosystem Levels Remain Unaltered. (A) Immunoblot quantitation of LHCSR3. Five micrograms of chlorophyll of whole-cell extracts of wild-type (WT; CC-124) and amiRNA-cas-9 cells were fractionated on a 13% SDS-PAGE gel. LHCSR3, PSAD, and CF1 abundances were analyzed by immunoblots. CF1 signal served as a loading control. The cells were initially grown in LL TAP and were then shifted for 2 h to HL 80% HSM, containing the indicated amount of CaCl2 or EGTA. (B) Immunoblot analysis of PSBA abundance in whole-cell extracts of the wild type (CC-124) and amiRNA-cas-9 exposed to HL for 2 h in 80% HSM. Five micrograms of chlorophyll were loaded per lane of the SDS-PAGE gel. CF1 signal was used as loading control. (C) Amounts of CAS, LHCSR3, subunits of PSI and PSII, and ATPase from the wild type (CC-124) and amiRNA-cas-9 exposed to HL for 2 h in 80% HSM were analyzed by a quantitative comparative proteomics approach. In this graph, the ratios of 14N-labeled (amiRNA-cas-9) and 15N-labeled (wild-type CC-124) are presented (mean values and their respective sd).
Figure 6.
Figure 6.
W7 and Mastoparan Drug Studies Point to the Involvement of Calcium and Calmodulin in the Light-Dependent Regulation of LHCSR3 Expression. (A) Wild-type cells (CC-124) were shifted for 2 h from LL TAP to HL 80% HSM containing the indicated concentrations of the calmodulin antagonist W7 and its inactive analog W5 (which served as negative control). Chlorophyll (2.5 μg) of whole-cell extracts was fractionated on a 13% SDS-PAGE, and LHCSR3 abundance was analyzed by immunoblots. CF1 signal served as a loading control. (B) and (C) Irradiance dependence of quantum yield of PSII (B) and NPQ induction (C) in the wild-type (CC-124) cells of the experiment described in (A). The white bar indicates irradiation with white light at 890 μE m−2 s−1, and the black bar indicates darkness. Values plotted are the means of three measurements ± sd. (D) As described in (A) with the difference that wild-type cells were grown in HL and TAP for 12 h before their 2-h HL treatment in 80% HSM. (E) and (F) As described in (B) and (C) but referring to the experiment of (D). (G) Wild-type cells (CC-124) grown in LL and TAP were exposed to HL for 2 h in 80% HSM containing the indicated concentrations of mastoparan and its inactive analog mas-17 (which served as negative control). Whole-cell extracts (2.5 μg of chlorophyll) were fractionated on a 13% SDS-PAGE, and LHCSR3 abundance was analyzed by immunoblots. CF1 signal served as a loading control. (H) and (I) Irradiance dependence of quantum yield of PSII (H) and NPQ induction (I) of the wild-type (CC-124) cells of the experiment described in (G). The white bar indicates irradiation with light at 890 μE m−2 s−1, and the black bar indicates darkness. Values plotted are the means of three samples ± sd.
Figure 7.
Figure 7.
Photosynthetic Electron Transfer Is Involved in the Regulation of LHCSR3 Expression. (A) Expression of LHCSR3 requires active photosynthetic electron transfer. Wild-type cells (WT; cw15-arg7) in the presence and absence of DCMU (20 μM) or DBMIB (20 μM) as well as nac2 (PSII-deficient mutant; Kuchka et al., 1989) and Δpsab (PSI-deficient mutant; Redding et al., 1998) mutant cells were exposed in HL for 2 h in 80% HSM. Subsequently, whole-cell extracts (2.5 μg of chlorophyll) were fractionated on a 13% SDS-PAGE gel, and LHCSR3 abundance was analyzed by immunoblots. CF1 signal served as a loading control. (B) Impact of nigericin (0.25 to 1.0 μM) in LHCSR3 expression in wild-type cells (CC-124) during a 2-h HL shift experiment in 80% HSM. Protein analyses were performed as described in (A).
Figure 8.
Figure 8.
amiRNA-cas-1 and -6 Show Unaltered Fv/Fm Compared with the Wild Type but Diminished NPQ Induction and PSII Recovery, Which Can Be Rescued by Calcium. (A) Quantification of CAS amounts in thylakoids isolated from the wild type (cw15-325) and amiRNA-cas-6 grown under LL in TAP-NH4 (amiRNA expression repressed) or TAP-NO3 (amiRNA expression activated) upon SDS-PAGE fractionation and immunoblot analysis (100% equals 70 μg of protein per lane; CF1 signal served as loading control). Densitometric analyses showed that CAS levels in amiRNA-cas-6 are reduced by 40% compared with the wild-type levels (in NO3). (B) and (C) Determination of PSII quantum yield and recovery and NPQ. The wild type, amiRNA-cas-1, and amiRNA-cas-6 were initially shifted from LL TAP-NH4 to LL TAP-NO3 for 40 h to activate the amiRNA expression and subsequently shifted to HL in either HSM-NH4 or HSM-NO3 containing 0.34 or 3.06 mM Ca2+ for 24 h. After 20 min of dark adaptation, the quantum yields of PSII (B) and NPQ (C) were recorded during 5.2 min of illumination at 800 μE m−2 s−1 (white bar) followed by 4.3 min of darkness (black bar), during which recovery of PSII and relaxation of NPQ could be followed. Values plotted are the means of three measurements ± sd. (D) Quantification of LHCSR3 amounts in the wild type (cw15-325) and amiRNA-cas-6. Cells were initially shifted from LL TAP-NH4 to LL TAP-NO3 for 40 h to activate the amiRNA expression and subsequently shifted to HL in either HSM-NH4 or HSM-NO3 containing 0.34 or 3.06 mM Ca2+ for 24 h. Before exposure to HL, the cultures were set to 2.5 μg chlorophyll/mL. Whole-cell extracts (2.5 μg of chlorophyll) were fractionated on a 13% SDS-PAGE, and LHCSR3 abundance was analyzed by immunoblots. CF1 signal served as a loading control.
Figure 9.
Figure 9.
lhcsr3-kd Lines Show an HL Phenotype Similar to the cas-kd Lines and This Cannot Be Rescued by Calcium. (A) Quantification of LHCSR3, LHCBM6, and LHCII amounts in whole-cell extracts of the wild type (cw15-325) and amiRNA-lhcsr3-2 upon SDS-PAGE fractionation and immunoblot analysis (100% equals 2.5 μg of chlorophyll per lane; CF1 signal served as loading control). The wild type and amiRNA-lhcsr3-2 were initially shifted from LL TAP-NH4 to LL TAP-NO3 for 40 h to activate the amiRNA expression and subsequently shifted for 2 h to HL in either HSM-NH4 or HSM-NO3 containing 0.34 or 3.06 mM Ca2+. Before exposure to HL, the cultures were set to 2.5 μg chlorophyll/mL. (B) and (C) Determination of PSII quantum yield and recovery and NPQ. The wild type, amiRNA-lhcsr3-2, and amiRNA-lhcsr3-3 were initially shifted from LL TAP-NH4 to LL TAP-NO3 for 40 h to activate the amiRNA expression and subsequently shifted for 2 h to HL in either HSM-NH4 or HSM-NO3 containing 0.34 or 3.06 mM CaCl2. After 20 min of dark adaptation, the quantum yield of PSII (B) and NPQ (C) were recorded during 5.2 min of illumination at 800 μE m−2 s−1 (white bar) followed by 4.3 min of darkness (black bar), during which recovery of PSII and relaxation of NPQ could be followed. Values plotted are the means of three measurements ± sd.

Similar articles

Cited by

References

    1. Alboresi A., Gerotto C., Giacometti G.M., Bassi R., Morosinotto T. (2010). Physcomitrella patens mutants affected on heat dissipation clarify the evolution of photoprotection mechanisms upon land colonization. Proc. Natl. Acad. Sci. USA 107: 11128–11133 - PMC - PubMed
    1. Allmer J., Naumann B., Markert C., Zhang M., Hippler M. (2006). Mass spectrometric genomic data mining: Novel insights into bioenergetic pathways in Chlamydomonas reinhardtii. Proteomics 6: 6207–6220 - PubMed
    1. Berridge M.J., Irvine R.F. (1989). Inositol phosphates and cell signalling. Nature 341: 197–205 - PubMed
    1. Berthold P., Tsunoda S.P., Ernst O.P., Mages W., Gradmann D., Hegemann P. (2008). Channelrhodopsin-1 initiates phototaxis and photophobic responses in chlamydomonas by immediate light-induced depolarization. Plant Cell 20: 1665–1677 - PMC - PubMed
    1. Bouché N., Scharlat A., Snedden W., Bouchez D., Fromm H. (2002). A novel family of calmodulin-binding transcription activators in multicellular organisms. J. Biol. Chem. 277: 21851–21861 - PubMed

Publication types

MeSH terms

LinkOut - more resources