

Linked opening angle and histological and mechanical aspects of the proximal pulmonary arteries of healthy and pulmonary hypertensive rats and calves
- PMID: 21856906
- PMCID: PMC3213979
- DOI: 10.1152/ajpheart.00025.2011
Linked opening angle and histological and mechanical aspects of the proximal pulmonary arteries of healthy and pulmonary hypertensive rats and calves
Abstract
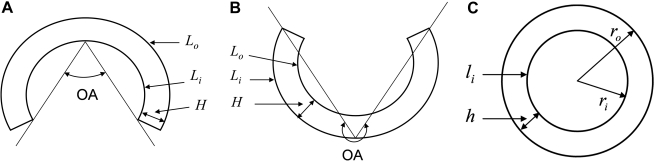
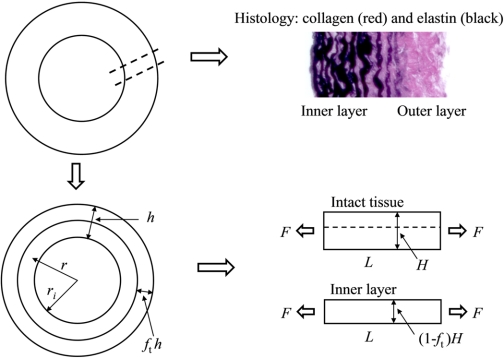
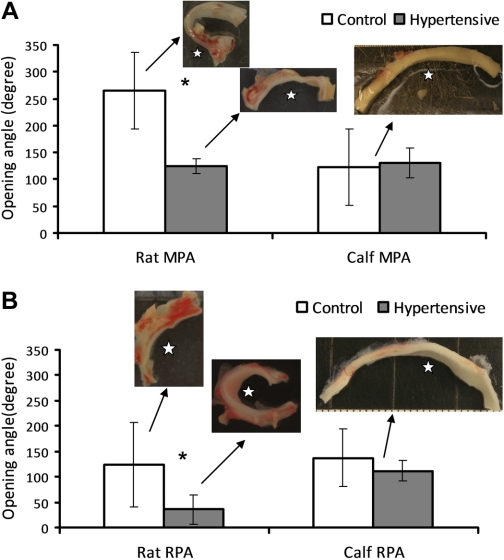
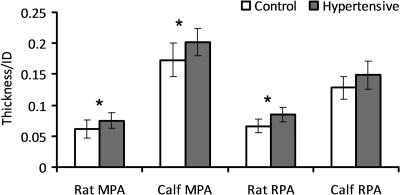
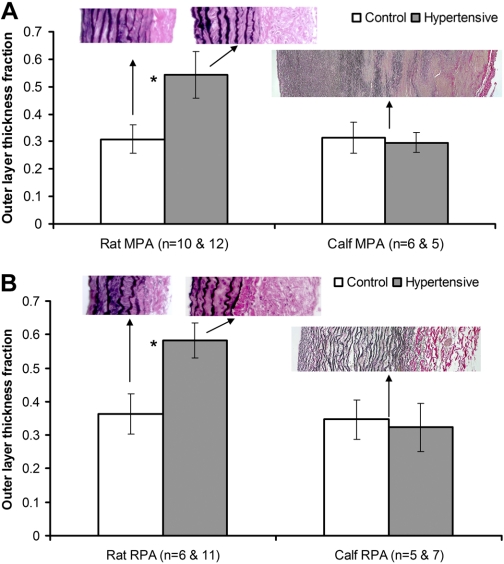
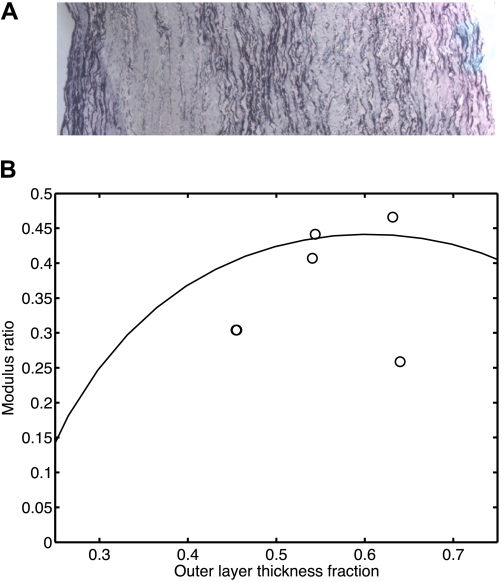
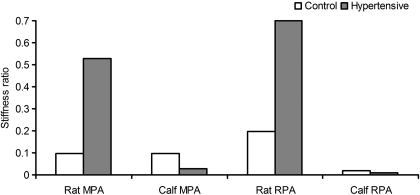
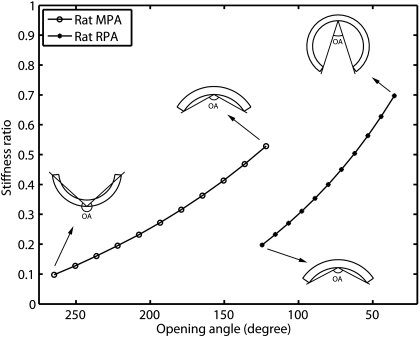
Understanding how arterial remodeling changes the mechanical behavior of pulmonary arteries (PAs) is important to the evaluation of pulmonary vascular function. Early and current efforts have focused on the arteries' histological changes, their mechanical properties under in vitro mechanical testing, and their zero-stress and no-load states. However, the linkage between the histology and mechanical behavior is still not well understood. To explore this linkage, we investigated the geometry, residual stretch, and histology of proximal PAs in both adult rat and neonatal calf hypoxic models of pulmonary hypertension (PH), compared their changes due to chronic hypoxia across species, and proposed a two-layer mechanical model of artery to relate the opening angle to the stiffness ratio of the PA outer to inner layer. We found that the proximal PA remodeling in calves was quite different from that in rats. In rats, the arterial wall thickness, inner diameter, and outer layer thickness fraction all increased dramatically in PH and the opening angle decreased significantly, whereas in calves, only the arterial wall thickness increased in PH. The proposed model predicted that the stiffness ratio of the calf proximal PAs changed very little from control to hypertensive group, while the decrease of opening angle in rat proximal PAs in response to chronic hypoxia was approximately linear to the increase of the stiffness ratio. We conclude that the arterial remodeling in rat and calf proximal PAs is different and the change of opening angle can be linked to the change of the arterial histological structure and mechanics.
Figures
Similar articles
-
Impact of chronic hypoxia on proximal pulmonary artery wave propagation and mechanical properties in rats.Am J Physiol Heart Circ Physiol. 2018 Jun 1;314(6):H1264-H1278. doi: 10.1152/ajpheart.00695.2017. Epub 2018 Mar 16. Am J Physiol Heart Circ Physiol. 2018. PMID: 29547024 Free PMC article.
-
Impact of residual stretch and remodeling on collagen engagement in healthy and pulmonary hypertensive calf pulmonary arteries at physiological pressures.Ann Biomed Eng. 2012 Jul;40(7):1419-33. doi: 10.1007/s10439-012-0509-4. Epub 2012 Jan 12. Ann Biomed Eng. 2012. PMID: 22237861 Free PMC article.
-
Changes of zero-stress state of rat pulmonary arteries in hypoxic hypertension.J Appl Physiol (1985). 1991 Jun;70(6):2455-70. doi: 10.1152/jappl.1991.70.6.2455. J Appl Physiol (1985). 1991. PMID: 1885439
-
Cellular adaptation during chronic neonatal hypoxic pulmonary hypertension.Am J Physiol. 1991 Oct;261(4 Suppl):97-104. doi: 10.1152/ajplung.1991.261.4.L97. Am J Physiol. 1991. PMID: 1928459 Review.
-
Pulmonary vascular stiffness: measurement, modeling, and implications in normal and hypertensive pulmonary circulations.Compr Physiol. 2011 Jul;1(3):1413-35. doi: 10.1002/cphy.c100005. Compr Physiol. 2011. PMID: 23733649 Free PMC article. Review.
Cited by
-
Stretch calculated from grip distance accurately approximates mid-specimen stretch in large elastic arteries in uniaxial tensile tests.J Mech Behav Biomed Mater. 2015 Jul;47:107-113. doi: 10.1016/j.jmbbm.2015.03.016. Epub 2015 Apr 3. J Mech Behav Biomed Mater. 2015. PMID: 25881308 Free PMC article.
-
Stiffening-induced high pulsatility flow activates endothelial inflammation via a TLR2/NF-κB pathway.PLoS One. 2014 Jul 16;9(7):e102195. doi: 10.1371/journal.pone.0102195. eCollection 2014. PLoS One. 2014. Retraction in: PLoS One. 2019 Jul 29;14(7):e0220600. doi: 10.1371/journal.pone.0220600. PMID: 25029271 Free PMC article. Retracted.
-
In vivo and in vitro measurements of pulmonary arterial stiffness: A brief review.Pulm Circ. 2012 Oct;2(4):505-17. doi: 10.4103/2045-8932.105040. Pulm Circ. 2012. PMID: 23372936 Free PMC article.
-
Pulmonary artery relative area change is inversely related to ex vivo measured arterial elastic modulus in the canine model of acute pulmonary embolization.J Biomech. 2014 Sep 22;47(12):2904-10. doi: 10.1016/j.jbiomech.2014.07.013. Epub 2014 Jul 30. J Biomech. 2014. PMID: 25128393 Free PMC article.
-
Study of the Effect of Treatment With Atrial Natriuretic Peptide (ANP) and Cinaciguat in Chronic Hypoxic Neonatal Lambs on Residual Strain and Microstructure of the Arteries.Front Bioeng Biotechnol. 2020 Nov 10;8:590488. doi: 10.3389/fbioe.2020.590488. eCollection 2020. Front Bioeng Biotechnol. 2020. PMID: 33244466 Free PMC article.
References
-
- Altenbach H, Altenbach J, Kissing W. Mechanics of Composite Structural Elements. New York: Springer-Verlag, 2004, p. 78–84
-
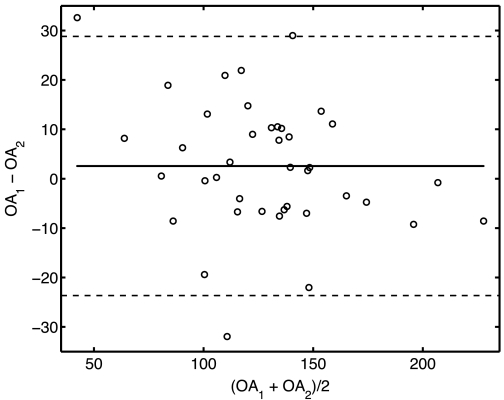
- Bland JM, Altman DG. Statistical methods for assessing agreement between two methods of clinical measurement. Lancet 1: 307–310, 1986 - PubMed
-
- Carew TE, Vaishnav RN, Patel DJ. Compressibility of the arterial wall. Circ Res 23: 61–68, 1968 - PubMed
-
- Chuong CJ, Fung YC. Compressibility and constitutive equation of arterial wall in radial compression experiments. J Biomech 17: 35–40, 1984 - PubMed
-
- Chuong CJ, Fung YC. On residual stresses in arteries. ASME J Biomech Eng 108: 189–192, 1986 - PubMed
Publication types
MeSH terms
Grants and funding
LinkOut - more resources
Full Text Sources
Medical