. 2011 Aug 21;14(9):1209-16.
doi: 10.1038/nn.2902.

Lateral habenula neurons signal errors in the prediction of reward information

Affiliations

Lateral habenula neurons signal errors in the prediction of reward information

Ethan S Bromberg-Martin et al. Nat Neurosci. .

Erratum in

  • Nat Neurosci. 2011 Dec;14(12):1617

Abstract

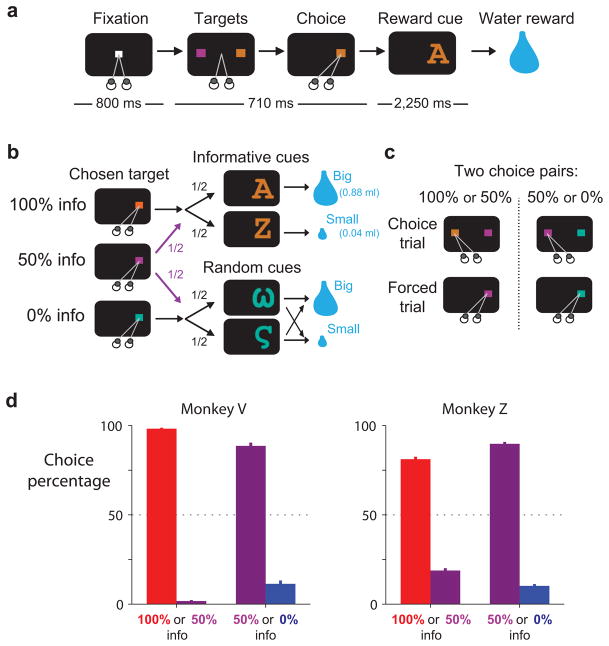
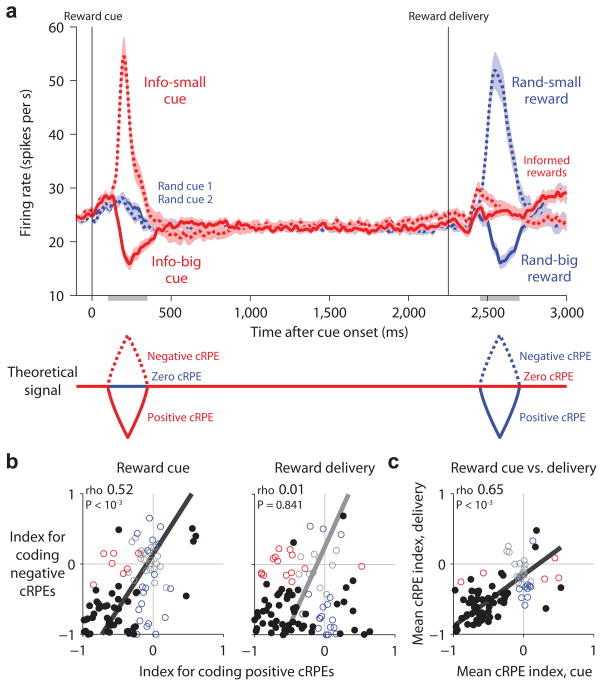
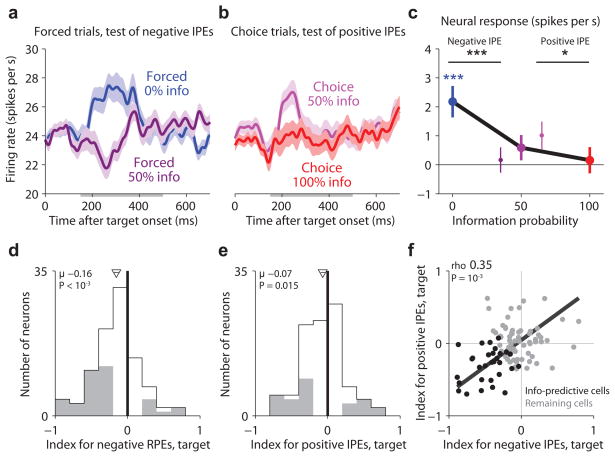
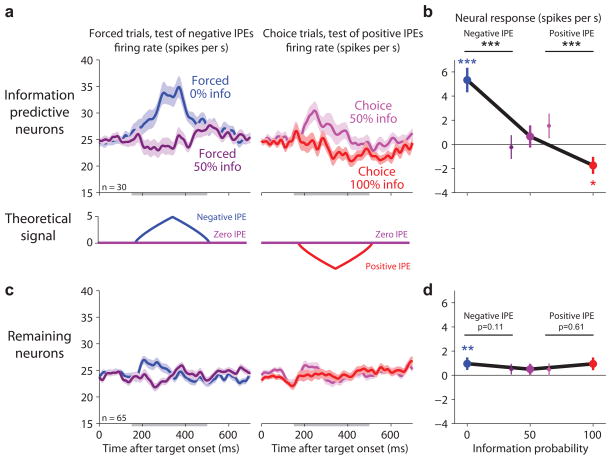
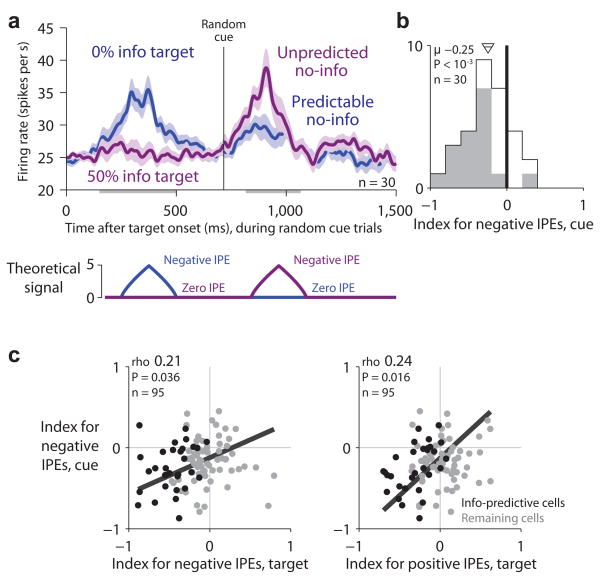
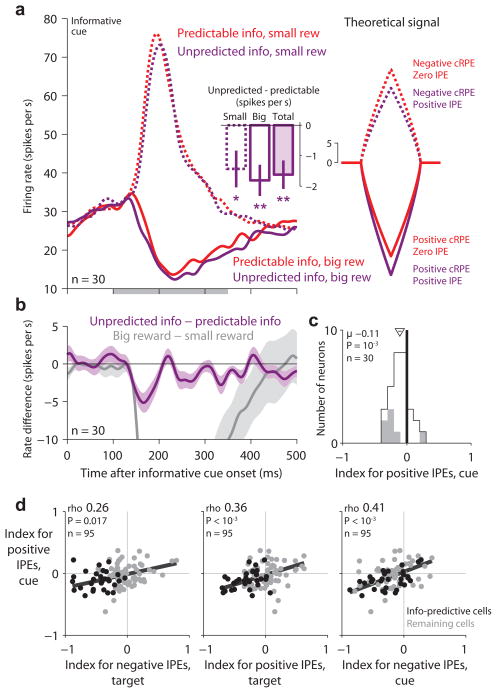
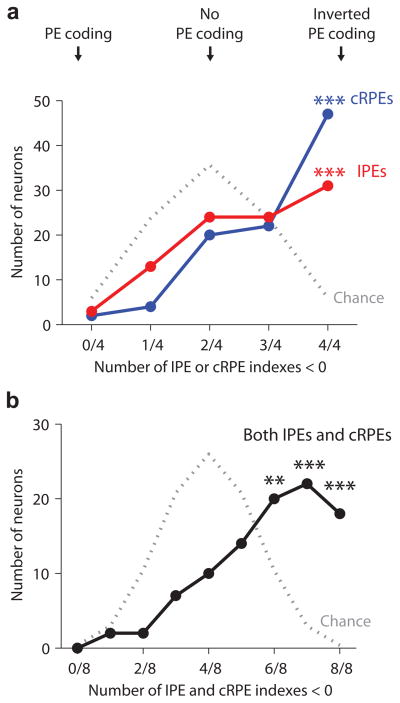
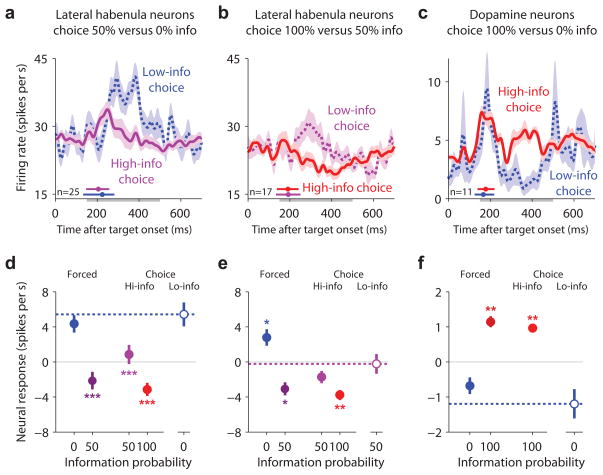
Humans and animals have the ability to predict future events, which they cultivate by continuously searching their environment for sources of predictive information. However, little is known about the neural systems that motivate this behavior. We hypothesized that information-seeking is assigned value by the same circuits that support reward-seeking, such that neural signals encoding reward prediction errors (RPEs) include analogous information prediction errors (IPEs). To test this, we recorded from neurons in the lateral habenula, a nucleus that encodes RPEs, while monkeys chose between cues that provided different chances to view information about upcoming rewards. We found that a subpopulation of lateral habenula neurons transmitted signals resembling IPEs, responding when reward information was unexpectedly cued, delivered or denied. These signals evaluated information sources reliably, even when the monkey's decisions did not. These neurons could provide a common instructive signal for reward-seeking and information-seeking behavior.


Figures

Figure 1
Figure 1
Behavioral preference to view informative reward cues. (a) On each trial animals viewed a fixation point, used a saccadic eye movement to choose a colored visual target, viewed a visual cue, and received a big or small water reward. (b) The three potential targets led to informative reward cues with 100%, 50%, or 0% probability. (c) Targets were presented in two choice pairs, 100% versus 50% info and 50% versus 0% info. Choice trials were followed by forced trials to equalize exposure to the non-chosen option. (d) Animals expressed a strong preference to choose the target that led to a higher probability of viewing informative cues. Bars are mean choice percentages ±1 SE.
Figure 2
Figure 2
Lateral habenula neurons transmit an inverted reward prediction error signal. (a) Average firing rate of lateral habenula neurons in response to the reward cues (left) and reward outcomes (right) resembled a theoretical inverted cRPE signal (bottom; generated from the model in Supplementary Fig. 1c using the same response windows as for the neural data). Left: activity aligned at cue onset for the informative cues (red lines; big-reward cue, solid; small-reward cue, dashed), and the two random cues (blue solid and dashed lines). Right: activity aligned at reward onset for informed rewards (red lines; big reward, solid; small reward, dashed) and randomized rewards (blue; big reward, solid; small reward, dashed). Activity was smoothed with a Gaussian kernel (σ = 10 ms). Shaded regions represent the mean firing rate ±1 SE of the baseline-subtracted neural firing rate. Gray bars below the x-axis indicate the analysis windows. (b) Single-neuron cRPE indexes for responses to the cues (left) and reward delivery (right), calculated separately for positive cRPEs (x-axis) and negative cRPEs (y-axis). Colored dots indicate neurons with significant indexes along the x-axis (red), y-axis (blue), or both (black) (P < 0.05, rank-sum test). Text indicates rank correlation (rho) and its significance (permutation test); solid line indicates the best-fitting linear relationship using type 2 regression. (c) Single-neuron mean cRPE indexes for responses to the cues (x-axis) and reward delivery (y-axis). Same format as (b). Most neurons had consistent coding of cRPEs for both the cues and reward delivery.
Figure 3
Figure 3
Lateral habenula activity related to information prediction errors evoked by the information-predictive targets. (a) Average lateral habenula activity was higher on forced 0% info trials (blue) than forced 50% info trials (dark purple). Same format for smoothing and error regions as Fig. 2a. Gray bar below the x-axis indicates the analysis window. (b) Average lateral habenula activity was higher on choice trials when the animal chose 50% info in preference to 0% info (light purple) than when the animal chose 100% info in preference to 50% info (red). Same format as (a). (c) Mean baseline-subtracted activity in response to the target array on trials with 0%, 50%, and 100% info probability (blue, purple, red dots). Error bars are ±1 SE. Small data points next to the 50% info data point represent forced 50% info trials (dark purple, left) and choice 50% > 0% info trials (light purple, right). Colored asterisks are responses significantly different from baseline (*/**/*** for P < 0.05/0.01/0.001, signed-rank test). Black asterisks indicate significant effects of information probability. (d,e) Single neuron indexes for coding negative IPEs (d, forced trials) and positive IPEs (e, choice trials). Gray indicates indexes significantly different from 0 (P < 0.05, rank-sum test). Arrow and horizontal line indicate mean±SE, text indicates mean and significance (signed-rank test). (f) Correlation between indexes for negative and positive IPEs. Text indicates rank correlation and its significance (permutation test). Black dots are the “information-predictive neurons” (mean IPE index < 0, P < 0.05, permutation test; n=30).
Figure 4
Figure 4
Information-related signals are strongest in a subpopulation of neurons. (a,b) Average activity of the subpopulation of information-predictive neurons (top) resembles the theoretical inverted IPE signal (bottom, generated from the model in Supplementary Fig. 1b using the same response windows as for the neural data and plotting model rate on same scale as neural rate). Same format as Fig. 3a–c, but only showing activity from the information-predictive cells. These activity measurements were cross-validated to remove selection bias (Methods). (c,d) Average activity of the remaining neurons shows little or no sensitivity to IPEs. Same format as (a,b).
Figure 5
Figure 5
Lateral habenula activity related to negative information prediction errors evoked by denial of reward information. (a) Average activity of information-predictive neurons on trials when random cues were presented (top) resembled the theoretical inverted IPE signal (bottom; model uses the same conventions as in Fig. 4). Activity is shown in response to the target array (left) and the onset of the random cues (right) for trials when the information probability was 0% (blue, ‘predictable no-info’) or 50% (purple, ‘unpredicted no-info’). Same format for smoothing and error regions as Fig. 2a. This population was excited by unpredicted no-info. (b) Single-neuron indexes for coding negative IPEs in response to the random cues. Same format as Fig. 3d,e, but showing the subpopulation of information-predictive neurons. (c) Neurons with strong negative IPE signals in response to the random cues tended to have strong negative IPE signals (left) and positive IPE signals (right) in response to the targets. Same format as Fig. 3f.
Figure 6
Figure 6
Lateral habenula activity related to positive information prediction errors evoked by delivery of reward information. (a) Average activity of information-predictive neurons on trials when informative cues were presented (left) resembled the theoretical combined inverted IPE+cRPE signal (right; model uses the same conventions as in Fig. 4). Activity is shown in response to the onset of the informative cues (right) for trials when the information probability was 100% (red, ‘predictable info’) or 50% (purple, ‘unpredicted info’) and when the informative cue indicated a big reward (solid lines) or small reward (dashed lines). This population had strong excitation or inhibition encoding cRPEs, and also had a lower firing rate on ‘unpredicted info’ than ‘predictable info’ trials (inset: difference in firing rate between ‘unpredicted info’ and ‘predictable info’, calculated separately for small-reward, big-reward, and all trials; error bars are ± 1 SE; */** for P < 0.05/0.01, signed-rank test). (b) Activity difference related to information probability (purple, unpredicted info – predictable info) and cued reward value (gray, big reward – small reward). Shaded area indicates ± 1 SE. (c) Single-neuron indexes for coding positive IPEs in response to the informative cues. Same format as Fig. 3d,e, but showing the subpopulation of information-predictive neurons. (d) Neurons with strong coding of positive IPEs evoked by the informative cues (y-axis) also tended to have strong coding of positive IPEs evoked by the targets (middle) and negative IPEs evoked by the random cues (left) and targets (right). Same format as Fig. 3f.
Figure 7
Figure 7
Joint coding of IPEs and conventional RPEs in single neurons. (a) Histogram of all lateral habenula neurons sorted by their total number of IPE indexes (red) or cRPE indexes (blue) that were below zero, indicating coding of inverted prediction errors (counting all four cRPE indexes from Fig. 2b and all four IPE indexes from Figs. 3f,5b,6c). Gray dotted line indicates the null hypothesis that the indexes were randomly distributed above or below zero by chance. Asterisks indicate response patterns that occurred in more neurons than expected by chance (*/**/*** for P < 0.05/0.01/0.001, binomial test). (b) Same as (a) for the combined count of cRPE and IPE indexes that were below zero (considering all eight indexes). The most common patterns were to have six, seven, or eight indexes below zero, indicating inverted coding cRPEs and IPEs.
Figure 8
Figure 8
Lateral habenula and dopamine neurons signal information probability reliably despite variable decisions. (a) Information-predictive lateral habenula neurons had higher activity when animals made low-info choices of 0% info > 50% info (dashed blue line) than when they made high-info choices of 50% info > 0% info (purple). Activity is shown for all neurons recorded during at least one choice of 0% info > 50% info. Same format for smoothing and error regions as Fig. 2a. The small colored circles above the x-axis indicate the median saccadic reaction time for each condition; the horizontal colored lines indicate the central 90% of the reaction time distribution. (b) Same as (a), for choices between 50% info (purple) vs. 100% info (red). (c) Same as (a,b), for putative dopamine neurons recorded during choices between 0% info (blue) vs. 100% info (red). (d) Mean baseline-subtracted activity during forced trials (left), high-info choice trials (middle), and low-info choice trials (right, open circle and dashed line), for information-predictive lateral habenula neurons recorded during at least one low-info choice of 0% info > 50% info. Error bars are ± 1 SE. Asterisks indicate responses that were significantly different from those on low-info choice trials (*/**/*** for P < 0.05/0.01/0.001, signed-rank test). (e,f) Same as (d), for the neurons shown in (b,c).

Comment in

References

    1. Schultz W, Dayan P, Montague PR. A neural substrate of prediction and reward. Science. 1997;275:1593–9. - PubMed
    1. Rescorla RA, Wagner AR. In: Classical Conditioning II: Current Research and Theory. Black AH, Prokasy WF, editors. Appleton Century Crofts; New York, New York: 1972. pp. 64–99.
    1. Bayer HM, Glimcher PW. Midbrain dopamine neurons encode a quantitative reward prediction error signal. Neuron. 2005;47:129–41. - PMC - PubMed
    1. Seo H, Lee D. Temporal filtering of reward signals in the dorsal anterior cingulate cortex during a mixed-strategy game. J Neurosci. 2007;27:8366–77. - PMC - PubMed
    1. Matsumoto M, Matsumoto K, Abe H, Tanaka K. Medial prefrontal cell activity signaling prediction errors of action values. Nat Neurosci. 2007;10:647–56. - PubMed

Publication types