. 2011 Aug 21;7(10):692-700.
doi: 10.1038/nchembio.634.

Multiple ligand-specific conformations of the β2-adrenergic receptor

Affiliations

Multiple ligand-specific conformations of the β2-adrenergic receptor

Alem W Kahsai et al. Nat Chem Biol. .

Abstract

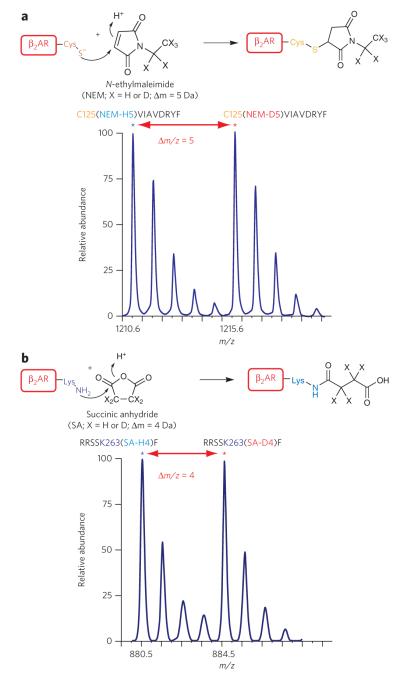
Seven-transmembrane receptors (7TMRs), also called G protein-coupled receptors (GPCRs), represent the largest class of drug targets, and they can signal through several distinct mechanisms including those mediated by G proteins and the multifunctional adaptor proteins β-arrestins. Moreover, several receptor ligands with differential efficacies toward these distinct signaling pathways have been identified. However, the structural basis and mechanism underlying this 'biased agonism' remains largely unknown. Here, we develop a quantitative mass spectrometry strategy that measures specific reactivities of individual side chains to investigate dynamic conformational changes in the β(2)-adrenergic receptor occupied by nine functionally distinct ligands. Unexpectedly, only a minority of residues showed reactivity patterns consistent with classical agonism, whereas the majority showed distinct patterns of reactivity even between functionally similar ligands. These findings demonstrate, contrary to two-state models for receptor activity, that there is significant variability in receptor conformations induced by different ligands, which has significant implications for the design of new therapeutic agents.


Figures

Figure 1
Figure 1. Labeling of cysteines and lysines in the β2AR to monitor conformational changes
(a) top, reaction of thiolate anion of cysteine side chain with N-ethylmaleimide (neM-H5 or neM-d5) by nucleophilic addition at the double bond of the maleimide ring. bottom, representative isotope-peak pair (doublet) corresponding to a chymotryptic peptide ( 125cviAvdRYF133) modified at cys125 by a light and heavy neM (m/z 1210.6 and 1215.6, respectively; ~Δm/z = 5). (b) top, reaction of the ε-nH2 group of the lysine side chain with succinic anhydride (SA-H4 or SA-d4) by nucleophilic addition at one of the carbonyl groups. bottom, representative spectrum of doublet peaks corresponding to a chymotryptic peptide ( 259RRSSKF264) modified at lys263 by light and heavy succinic anhydride (m/z 880.5 and 884.5, respectively; ~Δm/z = 4).
Figure 2
Figure 2. Schematic two-dimensional topology of human β2AR showing location of sites of study
A total of nine amino acids in single-letter code are highlighted. cysteines are shown in orange and lysines are shown in blue. the numbers indicate positions of the amino acid sequence.
Figure 3
Figure 3. Schematic illustration of time-dependent, residue-specific labeling experiment designed to monitor conformational changes in the β2AR
(a,b) Strategy for labeling of cysteines in purified β2AR, initiated in two pools by adding either neM-H5 as in (a) or neM-d5 as in (b). equal amounts of the two pools are mixed, subjected to proteolysis, and MS-analyzed to determine peptide fragments that have been modified. (c) Representative doublets with singly charged ion ([M+H]+) peaks at m/z 1336.6 and 1341.7 that correspond to peptide 327cRSpdFRiAF336 modified at cys327 by neM and exhibit a mass difference of 5 da following modification with either neM-H5 or neM-d5 (details are listed in Supplementary Methods and Supplementary Fig. 4). (d) Representative time-course curves of the extent of neM reactivity at cys327, expressed as percent of sites labeled (%F) plotted versus labeling time in minutes on a logarithmic scale, after treatment with carrier solvent or indicated ligands. the solid lines in each plot are the best fit obtained after fitting to double exponential function. data represent the average of at least three independent experiments ± s.e.m.
Figure 4
Figure 4. Reactivities of residues in β2AR featuring conformational rearrangements of classic receptor activation
(a,b) effects of nine β2AR ligands on neM reactivity at cys77 (a) and at cys327 (b). insets indicate position of labeled residue in the β2AR snake-like diagram. bar graphs depict the reactivity of each site with the different ligands bound to the β2AR, indicated on the y-axis by l-factor values relative to the value for receptor without ligand. bars extending below the x-axis indicate lower l-factors, and bars extending above it indicate higher l-factors relative to the receptor without ligand. All l-factors shown are for the fast phase. data correspond to the means ± standard errors of at least three independent experiments. Asterisks indicate statistical significance (*P < 0.05) compared to control receptor alone by one-way AnovA.
Figure 5
Figure 5. Reactivities of residues in β2AR featuring ligand-specific conformational rearrangements
(ag) bar graphs summarizing the effects of various ligands on the changes in the l-factors of seven different sites of the β2AR, expressed relative to the receptor without ligand: cys125 (a), lys140 (b), lys227 (c), lys235 (d), lys263 (e), cys265 (f) and lys305 (g). All l-factors shown are for the fast phase except for lys305. l-factor for lys227 is not shown, as no detectable amplitude for the fast phase was observed. data correspond to the means ± standard errors from at least three independent experiments. Asterisks indicate statistical significance (*P < 0.05) compared to control receptor alone by one-way AnovA.
Figure 6
Figure 6. Proposed models Illustrating the conformational rearrangements observed in different structural elements of the β2AR
(a) A ribbon diagram of carazolol-bound β2AR-t4l (pdb: 2RH1) is shown on the left. top right, cys77 and cys327 are shown as yellow spheres, Asp79 in tM2 and NPxxY in tM7 are shown as sticks, water molecules as red spheres and hydrogen bonds as dashed red lines. bottom right, cytoplasmic end view of tM7 of the superposition of structures of opsin (magenta; pdb: 3dQb), rhodopsin (pale blue; pdb: 1GZM) and carazolol–β2AR–t4l highlighting structural rearrangement at the cytosolic end of tM7 of the β2AR (red arrow). (b) interactions of cys125 in tM3 with pro211 in tM5 and potential ligand-specific rearrangements of the side chain illustrated by the arrow in red. (c) locked conformation of icl2 (lys140 in blue sphere), pointing toward the 7tM-helical bundle in the carazolol–β2AR-t4l structure and alternative ligand-specific structural rearrangements of icl2 region (dashed red lines). (d) Residues (lys227, lys235, lys263 and cys265) in the intracellular loop (icl3) region and adjoining tMs 5 and 6 of β2AR. the side chains of lys263 and cys265 are oriented opposite to each other on the loop. the proposed structural rearrangement of icl3 (dashed red lines) is indicated by red arrow. (e) extracellular surface view of β2AR showing location of salt bridge between Asp192 (red spheres) and lys305 (blue sphere). tMs 1–7 are green, and ecls 1–3 are cyan. Figures were prepared with pyMol (delano Scientific).

References

    1. Lefkowitz RJ. Seven transmembrane receptors: something old, something new. Acta Physiol. (Oxf.) 2007;190:9–19. - PubMed
    1. Pierce KL, Premont RT, Lefkowitz RJ. Seven-transmembrane receptors. Nat. Rev. Mol. Cell Biol. 2002;3:639–650. - PubMed
    1. Lagerström MC, Schioth HB. Structural diversity of G protein-coupled receptors and significance for drug discovery. Nat. Rev. Drug Discov. 2008;7:339–357. - PubMed
    1. Lohse MJ, Benovic JL, Codina J, Caron MG, Lefkowitz RJ. beta-Arrestin: a protein that regulates beta-adrenergic receptor function. Science. 1990;248:1547–1550. - PubMed
    1. Luttrell LM, Lefkowitz RJ. The role of beta-arrestins in the termination and transduction of G-protein-coupled receptor signals. J. Cell Sci. 2002;115:455–465. - PubMed

Publication types