. 2011 Aug 21;18(9):1043-51.
doi: 10.1038/nsmb.2098.

Transfer RNA-mediated regulation of ribosome dynamics during protein synthesis

Affiliations

Transfer RNA-mediated regulation of ribosome dynamics during protein synthesis

Jingyi Fei et al. Nat Struct Mol Biol. .

Abstract

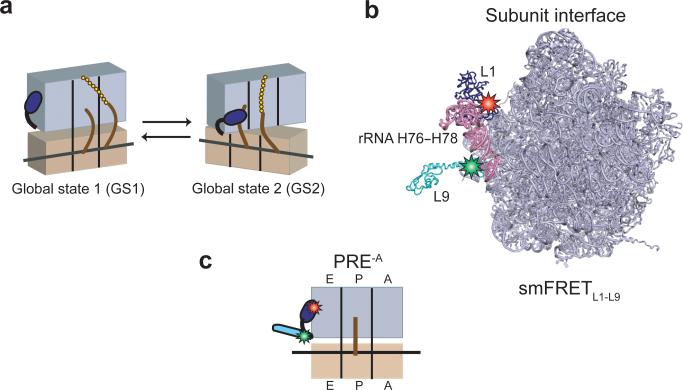
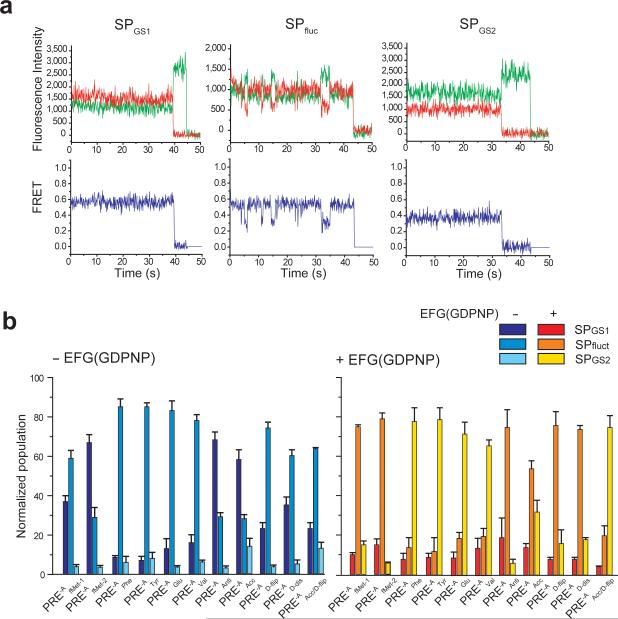
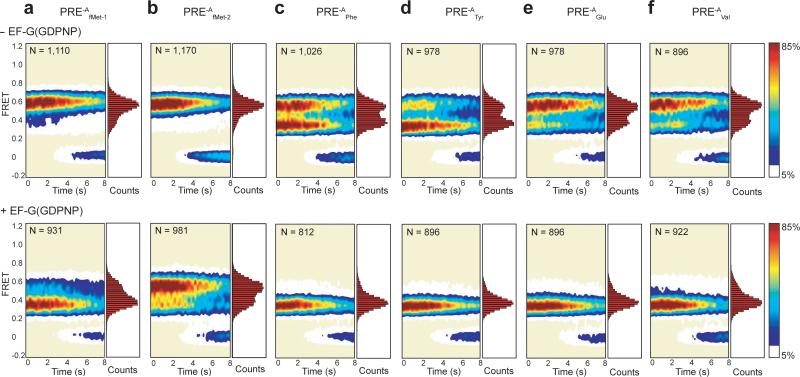
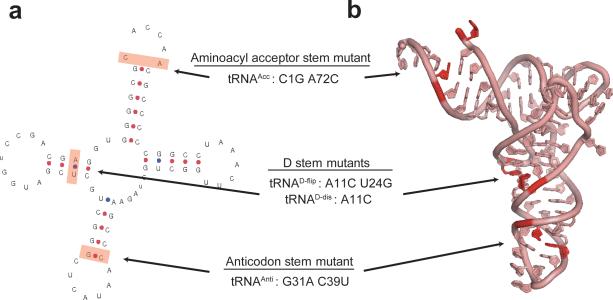
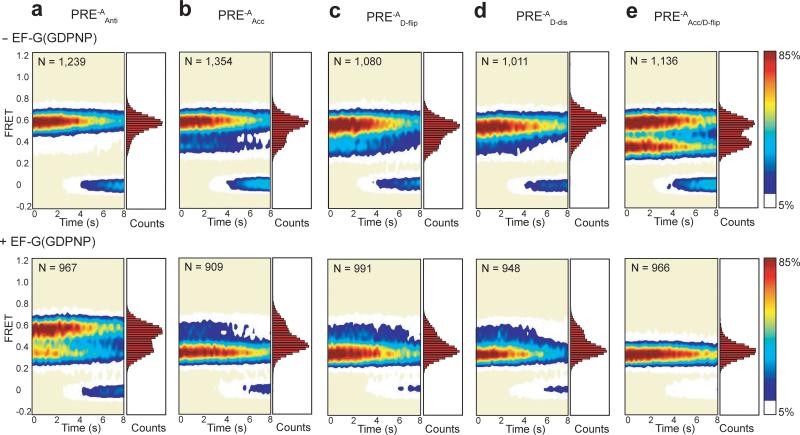
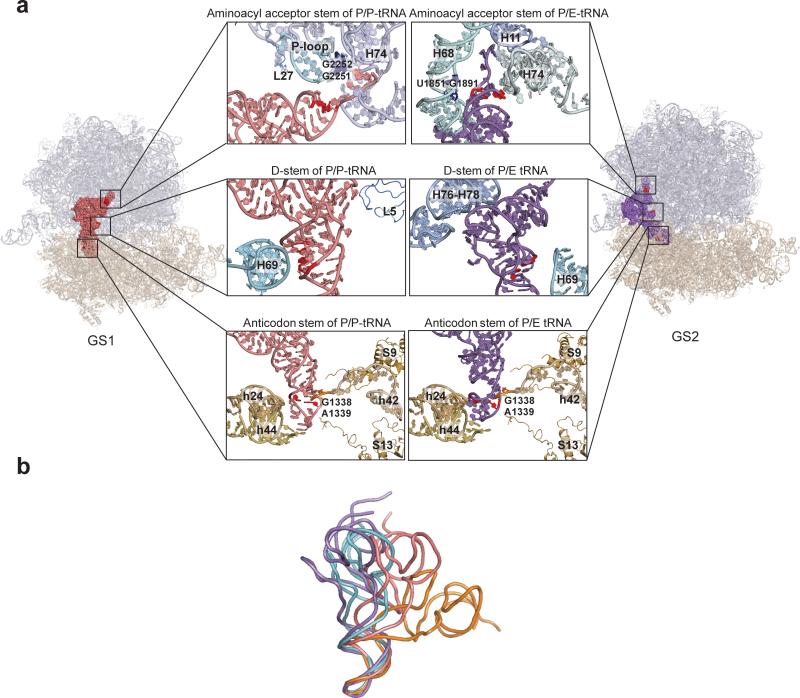
Translocation of tRNAs through the ribosome during protein synthesis involves large-scale structural rearrangement of the ribosome and ribosome-bound tRNAs that is accompanied by extensive and dynamic remodeling of tRNA-ribosome interactions. How the rearrangement of individual tRNA-ribosome interactions influences tRNA movement during translocation, however, remains largely unknown. To address this question, we used single-molecule FRET to characterize the dynamics of ribosomal pretranslocation (PRE) complex analogs carrying either wild-type or systematically mutagenized tRNAs. Our data reveal how specific tRNA-ribosome interactions regulate the rate of PRE complex rearrangement into a critical, on-pathway translocation intermediate and how these interactions control the stability of the resulting configuration. Notably, our results suggest that the conformational flexibility of the tRNA molecule has a crucial role in directing the structural dynamics of the PRE complex during translocation.


Figures

Figure 1
Figure 1. Global states model of the PRE complex, L1-L9 labeling strategy, and PRE-A complexes
(a) Cartoon representation of the global states model of the PRE complex. The 30S and 50S subunits are shown in tan and lavender, respectively, with the L1 stalk in dark blue. tRNAs are shown as brown curves and the nascent polypeptide as a chain of gold spheres. Upon aa-tRNA selection and peptide bond formation, the PRE complex spontaneously fluctuates between two major global conformational states, which we call global state 1 (GS1) and global state 2 (GS2). (b) Labeling strategy for smFRETL1-L9. The 50S subunit is shown from the perspective of the intersubunit space (PDB ID: 2J01). The L1 stalk consists of 23S rRNA helices 76-78 (pink) and r-protein L1 (dark blue). r-protein L9 is shown in cyan. The donor (Cy3) and the acceptor (Cy5) fluorophores are shown as green and red stars on r-proteins L9 and L1, respectively. The image was rendered using PyMol (www.pymol.org). (c) Cartoon representation of a PRE-A complex. PRE-A complexes are formed using an L1-L9 labeled 50S subunit and carry a deacylated P-site tRNA.
Figure 2
Figure 2. Sample smFRET versus time trajectories and relative occupancies of smFRET trajectory sub-populations
(a) Sample smFRET versus time trajectories. Three sub-populations of smFRET trajectories were observed. The first sub-population, which exhibits a stable FRET state centered at 0.56 ± 0.02, consists of PRE-A complexes that occupy GS1 and photobleach out of GS1 prior to undergoing a GS1→GS2 transition (SPGS1, left panel); the second sub-population, which exhibits fluctuations between two FRET states centered at 0.56 ± 0.02 and 0.36 ± 0.01, consists of PRE-A complexes that fluctuate between GS1 and GS2 during the observation period (SPfluct, middle panel); and the third sub-population, which exhibits a stable FRET state centered at 0.36 ± 0.01, consists of PRE-A complexes that occupy GS2 and photobleach out of GS2 prior to undergoing a GS2→GS1 transition (SPGS2, right panel). Representative Cy3 and Cy5 emission intensity versus time trajectories are shown in green and red, respectively (top row). The corresponding smFRET versus time trajectories, calculated using E = ICy5 / (ICy3 + ICy5), where E is the FRET efficiency at each time point and ICy3 and ICy5 are the emission intensities of Cy3 and Cy5, respectively, are shown in blue (bottom row). (b) Relative occupancies of the three sub-populations of smFRET trajectories. The percentage of smFRET trajectories occupying SPGS1, SPfluct and SPGS2 for each PRE-A complex in the absence (left panel) and presence (right panel) of EF-G(GDPNP) are shown as bar graphs. Data are the mean ± standard deviation of three independent measurements (see Supplementary Table 1).
Figure 3
Figure 3. Steady-state smFRET measurements on PRE-A complexes carrying wild-type and elongator tRNAs
Surface contour plots of the time evolution of population FRET were generated by superimposing the individual smFRET versus time trajectories for each PRE-A complex. Contours are plotted from white (lowest population) to red (highest population) as indicated by the color bar. The number of smFRET trajectories used to construct each contour plot is indicated by “N.” The corresponding one-dimensional FRET histograms plotted along the right-hand y-axis of the surface contour plots were generated using the first 20 time points from all of the FRET trajectories in each dataset. The PRE-A complexes in the absence of EF-G(GDPNP) are shown along the top row, and the corresponding PRE-A complexes in the presence of 2 μM EF-G(GDPNP) are shown along the bottom row. (a) PRE-AfMet-1. (b) PRE-AfMet-2. (c) PRE-APhe. (d) PRE-ATyr. (e) PRE-AGlu. (f) PRE-AVal.
Figure 4
Figure 4. Design of tRNAfMet2 mutants
(a) Secondary structure diagram for E. coli tRNAfMet2. The three unique structural features of tRNAfMet that differentiate it from all elongator tRNAs are highlighted in red and the mutations that were designed to convert these three structural features to those found in tRNAPhe are listed. (b) Three-dimensional structure of E. coli tRNAfMet2. The three unique structural features of tRNAfMet are colored as in the secondary structure diagram (PDB ID: 3CW6).
Figure 5
Figure 5. Steady-state smFRET measurements on PRE-A complexes carrying tRNAfMet2 mutants
Data are presented as in Figure 3. (a) PRE-AAnti. (b) PRE-AAcc. (c) PRE-AD-flip. (d) PRE-AD-dis. (e) PRE-AAcc/D-flip.
Figure 6
Figure 6. P-site tRNA-ribosome interactions within the GS1 and GS2 state of a PRE complex and comparative structural analysis of ribosome-free and ribosome-bound tRNAs
(a) P-site tRNA-ribosome interactions within the GS1 and GS2 state of a PRE complex. Quasi-atomic-resolution models for the GS1 (left panel) and GS2 (right panel) states of a PRE complex were generated by real space refinement using rigid body fitting of atomic-resolution structures of the E. coli ribosome (PDB IDs: 2AVY and 2AW4) and a P site-bound tRNA (PDB ID: 2J00) into the electron density obtained from cryo-EM reconstructions of the GS1 and GS2 states of a PRE complex (kindly provided by J. Frank, H. Gao, and X. Aguirrezabala). P/P- and P/E-configured tRNAs are shown in pink and purple, respectively. rRNA helices and r-proteins that interact with the aminoacyl acceptor stem (top panels), the D stem (middle panels) and the anticodon stem (bottom panels) of each tRNA are labeled in each figure and the nucleotide positions of the tRNAfMet2 mutations studied in the present work are shown in red. (b) Comparative structural analysis of ribosome-free and ribosome-bound tRNAs. Ribosome-free tRNAfMet(44) (PDB ID: 3CW6), A/T-configured tRNAThr(22) (PDB ID: 2WRN), P/P-configured tRNAfMet(31) (PDB ID: 2J00), and P/E-configured tRNAfMet (quasi-atomic-resolution model generated by molecular dynamics flexible fitting, kindly provided by K. Schulten and B. Liu) are shown in cyan, orange, pink and purple, respectively. The four tRNAs were superimposed using the anticodon stem loops (nucleotides 31-39 for the alignment of P/P-, P/E-configured tRNA to the ribosome-free tRNA, and nucleotides 32-38 for the alignment of A/T-configured tRNA to the ribosome-free tRNA) with PyMol (www.pymol.org).

Similar articles

Cited by

References

    1. Frank J, Gao H, Sengupta J, Gao N, Taylor DJ. The process of mRNA-tRNA translocation. Proc Natl Acad Sci U S A. 2007;104:19671–8. - PMC - PubMed
    1. Korostelev A, Noller HF. The ribosome in focus: new structures bring new insights. Trends Biochem Sci. 2007;32:434–41. - PubMed
    1. Shoji S, Walker SE, Fredrick K. Ribosomal Translocation: One Step Closer to the Molecular Mechanism. ACS Chem Biol. 2009 - PMC - PubMed
    1. Blanchard SC, Kim HD, Gonzalez RL, Jr., Puglisi JD, Chu S. tRNA dynamics on the ribosome during translation. Proc Natl Acad Sci U S A. 2004;101:12893–8. - PMC - PubMed
    1. Frank J, Gonzalez RL., Jr. Structure and dynamics of a processive brownian motor: the translating ribosome. Annu Rev Biochem. 2010;79:381–412. - PMC - PubMed

Publication types