. 2011 Aug 21;10(9):704-9.
doi: 10.1038/nmat3095.

In vivo and in vitro tracking of erosion in biodegradable materials using non-invasive fluorescence imaging

Affiliations

In vivo and in vitro tracking of erosion in biodegradable materials using non-invasive fluorescence imaging

Natalie Artzi et al. Nat Mater. .

Erratum in

  • Nat Mater. 2011 Nov;10(11):896

Abstract

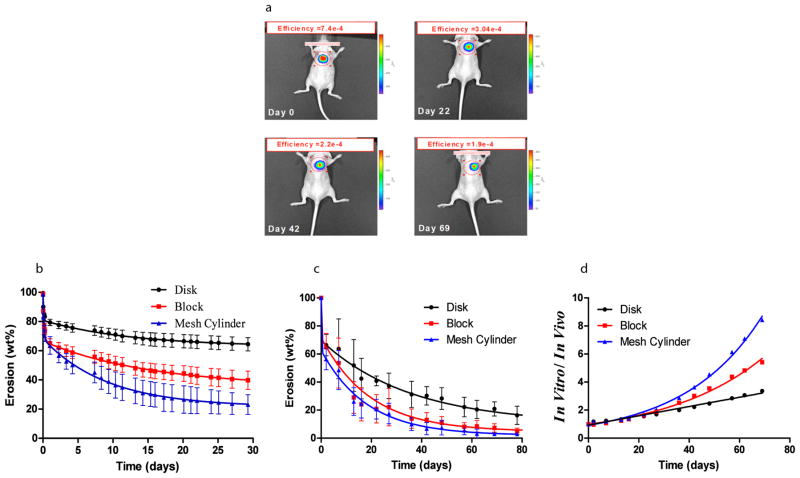
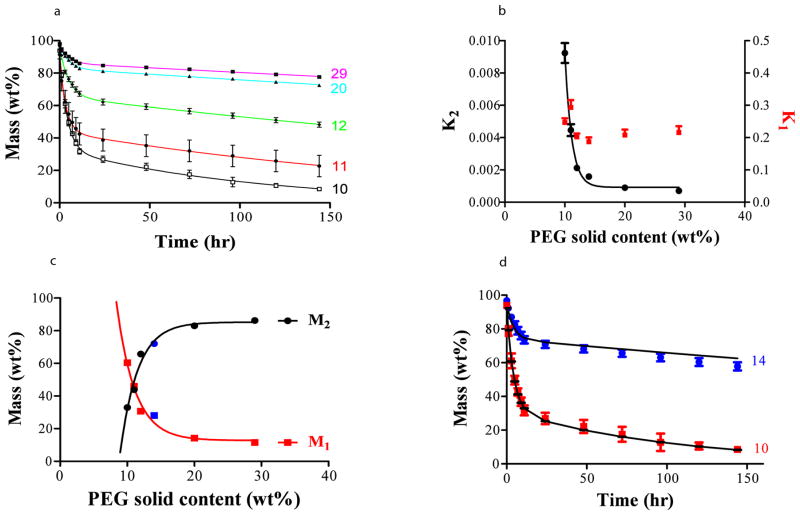
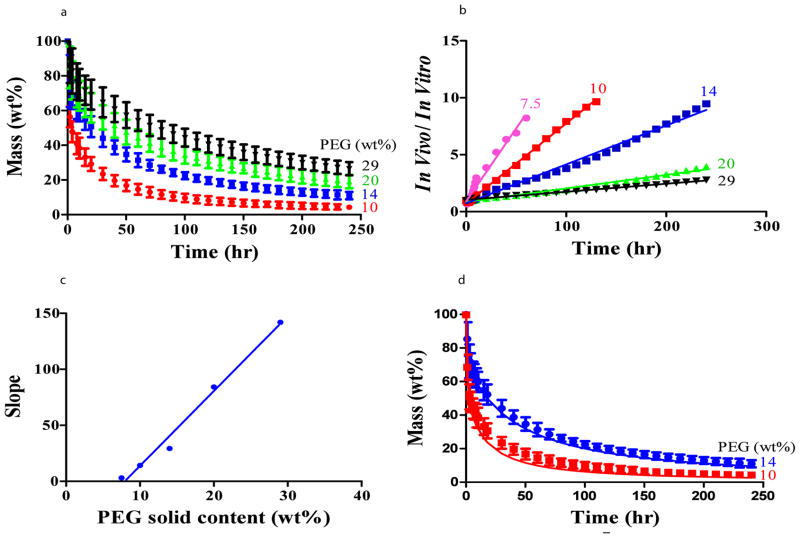
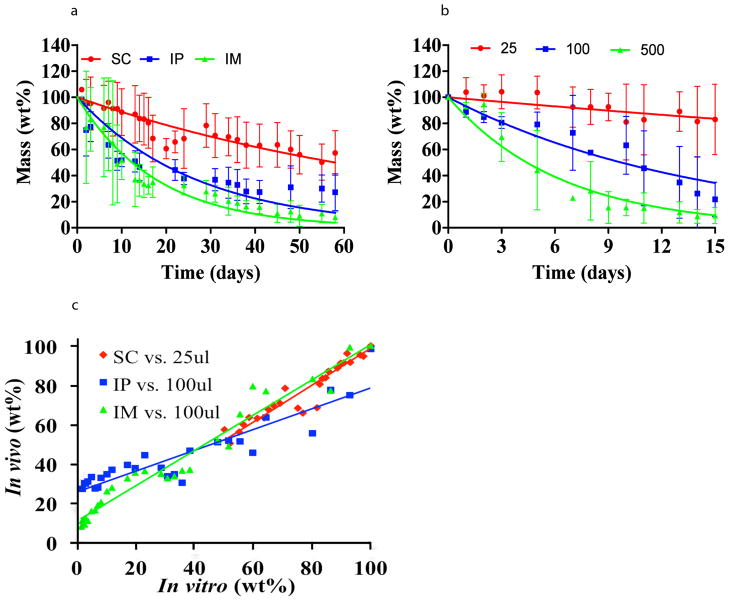
The design of erodible biomaterials relies on the ability to program the in vivo retention time, which necessitates real-time monitoring of erosion. However, in vivo performance cannot always be predicted by traditional determination of in vitro erosion, and standard methods sacrifice samples or animals, preventing sequential measures of the same specimen. We harnessed non-invasive fluorescence imaging to sequentially follow in vivo material-mass loss to model the degradation of materials hydrolytically (PEG:dextran hydrogel) and enzymatically (collagen). Hydrogel erosion rates in vivo and in vitro correlated, enabling the prediction of in vivo erosion of new material formulations from in vitro data. Collagen in vivo erosion was used to infer physiologic in vitro conditions that mimic erosive in vivo environments. This approach enables rapid in vitro screening of materials, and can be extended to simultaneously determine drug release and material erosion from a drug-eluting scaffold, or cell viability and material fate in tissue-engineering formulations.


Figures

Figure 1
Figure 1. In vitro – in vivo correlation of PEG:dextran erosion profiles exists and varies with material surface area
In vitro and in vivo erosion profiles of PEG-dextran (D10-50-14 P8-10-40) cast in a series of shapes are depicted by tracking the loss of fluorescence intensity with time. The effect of material shape on degradation profile was followed in vivo noninvasively in the dorsal subcutaneous space of the mouse (disk shaped materials are presented) (a), and in vitro (b). The loss of fluorescent signal with time in vivo was converted to weight loss (c) and correlated with the in vitro loss (d). An excellent correlation was found between mean values of in vitro and in vivo erosions of disk InvitroInvivodisk=0.033t+0.93; (R= 0.96), block InvitroInvivoblock=0.928·exp(0.27·t); (R= 0.94), and mesh cylinder InvitroInvivomesh=0.934·exp(0.032·t); (R= 0.98). Disk erosion in vivo tracked linearly with erosion in vitro (Figure 1d, R= 0.98). Thin blocks and mesh cylinders with significantly higher surface area than the disks (116, 190 and 86mm2 respectively) showed accelerated erosion in vitro compared with the erosion in vivo, leading to exponential dependence of the ratio between in vivo and in vitro erosion with time (Figure 1d, R= 0.99 for both shapes).
Figure 2
Figure 2
Dual exponential decay model describes PEG:dextran in vitro erosion and enables prospective prediction of erosion profile of new material formulations. Alteration of PEG solid content from 10 to 29wt% enables fine-tuning of material erosion kinetics (a). Model descriptors are presented as a function of PEG solid content. While k1 is constant and k2 decays exponentially (b); M1 and M2 similarly demonstrate reciprocal exponential changes with PEG solid content (c). The relationships between model descriptors and PEG solid content (PEGSC) are as follows: k2=53.7·exp(0.88·(PEGSC))+0.0009,M1=3979·exp(0.44·(PEGSC))+12.4andM2=3028·(1exp(0.41·(PEGSC))+85.4. Using the equations describing the relation between model descriptors and PEG solid content, the erosion profile of new compositions containing 10 and 14wt% PEG were prospectively predicted (points are empirically accumulated and lines are model predictions) (d). Constants were extrapolated from the data fits and are inserted in the figures as blue symbols, while squares represent k1 and M1 and circles represent k2 and M2. Predicted erosion correlated well with empiric observations (Pearson’s coefficient R= 0.99).
Figure 3
Figure 3. In vitro– in vivo correlation of PEG:dextran erosion profiles enables prediction of in vivo erosion kinetics from in vitro data
In vivo erosion of PEG-dextran formulations is depicted and follows the trend of the in vitro erosion profile, at a faster pace, as demonstrated for compositions with 10, 14, 20 or 29wt% PEG solid content (a). A linear relationship exists between the ratio of in vivo and in vitro erosion as a function of time for all PEG solid contents examined (b). The slopes of these curves linearly correlate with PEG solid content (c). Using this linear relationship, in vivo erosion profiles of two different formulations were accurately predicted from in vitro data (R=0.99) (points are empirically accumulated and lines are model predictions) (d).
Figure 4
Figure 4. In vivo erosion profile is site-dependant and can be used to infer physiologically relevant in vitro conditions for enzymatic materials
In vitro and in vivo erosion of compressed denatured type II collagen are presented. In vivo erosion at target sites that differ in enzyme concentration and fluid volume (Subcutaneous (SC), intraperitoneal (IP) and intramuscular (IM)) is site dependent and fits one exponential decay model (R=0.44, 0.77, and 0.7 for SC, IP and IM) (a). The in vivo erosion profiles were used to infer physiologically relevant conditions of diluent volume and enzyme concentration. While in vitro erosion depends both on enzyme concentration and fluid volume, a specific set of conditions resulted in an in vitro erosion profile (R=0.71, 0.9, and 0.95 for SC, IP and IM) (b) that linearly correlates with the in vivo erosion (c). The erosion in both domains fit an exponential decay model. A correlation between the erosion profiles in vitro and in vivo is achieved when SC implantation is plotted versus in vitro erosion of material submerged in 25μl of PBS solution containing physiological concentration of collagenase, and for IM and IP implantations when compared with in vitro erosion using 100μl of PBS containing enzyme solution. Linear correlation between in vitro and in vivo erosion enables screening of materials in vitro with in vivo prediction capacity.

References

    1. Bruggeman JP, de Bruin BJ, Bettinger CJ, Langer R. Biodegradable poly(polyol sebacate) polymers. Biomaterials. 2008;29:4726–4735. - PMC - PubMed
    1. Grayson AC, et al. Differential degradation rates in vivo and in vitro of biocompatible poly(lactic acid) and poly(glycolic acid) homo- and co-polymers for a polymeric drug-delivery microchip. Journal of biomaterials science. 2004;15:1281–1304. - PubMed
    1. Benny O, et al. In vivo fate and therapeutic efficacy of PF-4/CTF microspheres in an orthotopic human glioblastoma model. Faseb J. 2008;22:488–499. - PubMed
    1. Gopferich A. Mechanisms of polymer degradation and erosion. Biomaterials. 1996;17:103–114. - PubMed
    1. Anseth KS, Shastri VR, Langer R. Photopolymerizable degradable polyanhydrides with osteocompatibility. Nature biotechnology. 1999;17:156–159. - PubMed

Publication types