. 2011 Aug 21;43(9):854-9.
doi: 10.1038/ng.905.

MicroRNAs can generate thresholds in target gene expression

Affiliations

MicroRNAs can generate thresholds in target gene expression

Shankar Mukherji et al. Nat Genet. .

Abstract

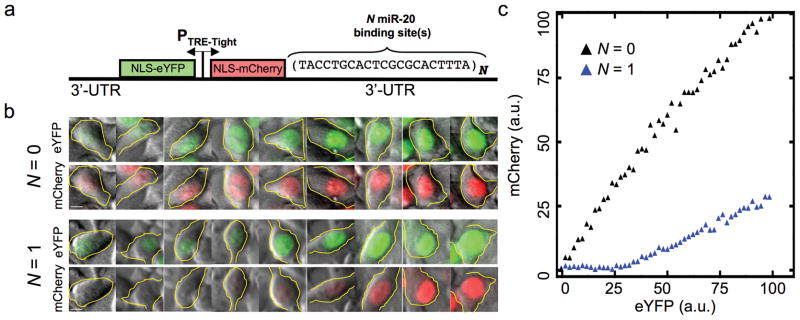
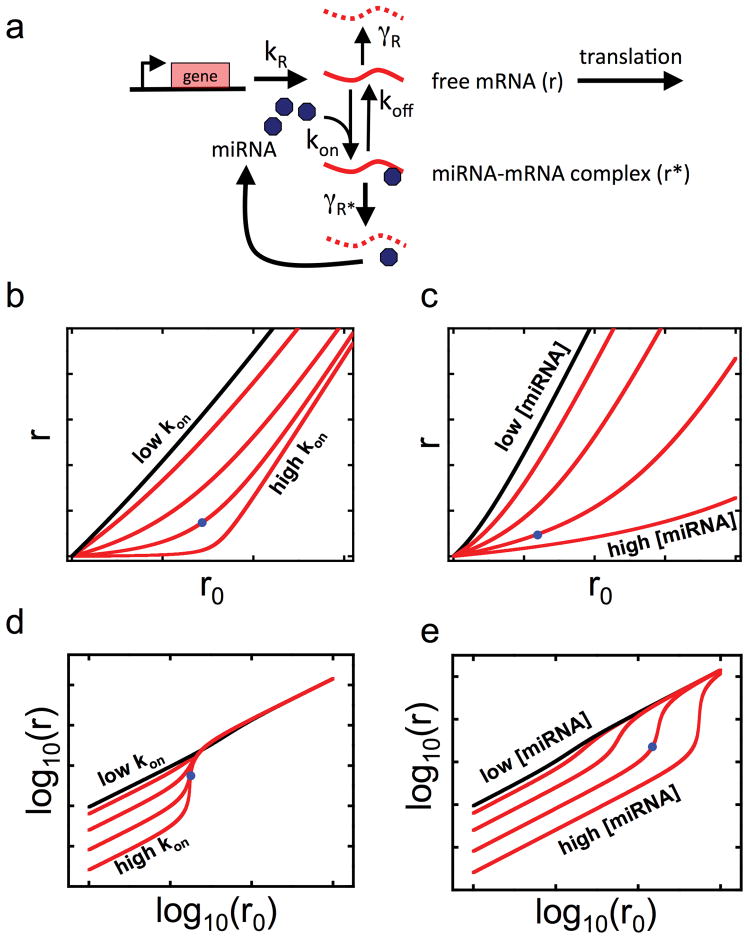
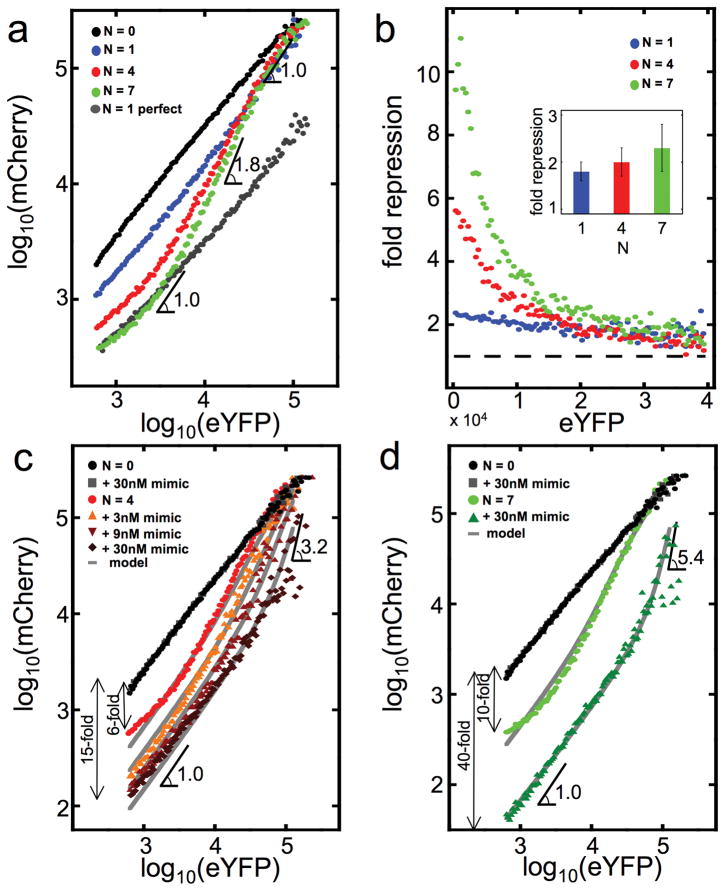
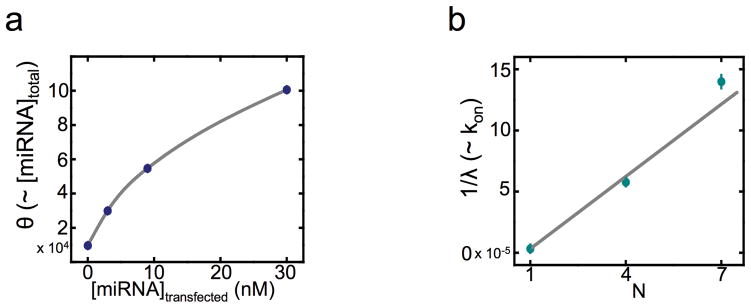
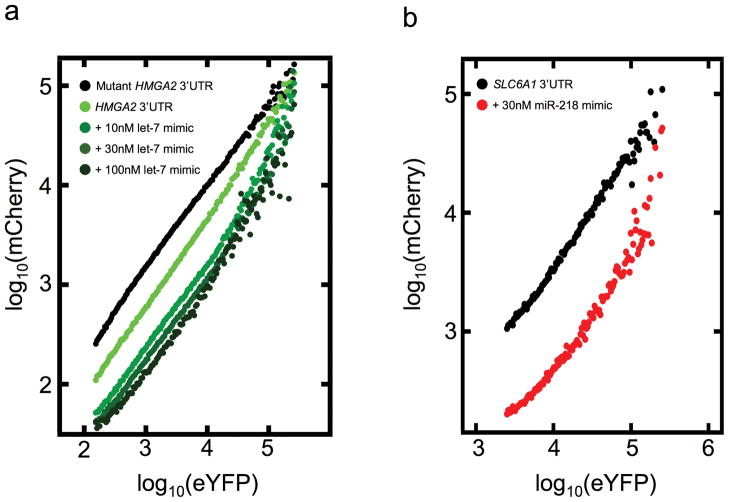
MicroRNAs (miRNAs) are short, highly conserved noncoding RNA molecules that repress gene expression in a sequence-dependent manner. We performed single-cell measurements using quantitative fluorescence microscopy and flow cytometry to monitor a target gene's protein expression in the presence and absence of regulation by miRNA. We find that although the average level of repression is modest, in agreement with previous population-based measurements, the repression among individual cells varies dramatically. In particular, we show that regulation by miRNAs establishes a threshold level of target mRNA below which protein production is highly repressed. Near this threshold, protein expression responds sensitively to target mRNA input, consistent with a mathematical model of molecular titration. These results show that miRNAs can act both as a switch and as a fine-tuner of gene expression.


Figures

Figure 1
Figure 1
Quantitative fluorescence microscopy reveals miRNA-mediated gene expression threshold. (a), The two-color fluorescent reporter construct consists of a bidirectional Tet promoter that co-regulates the enhanced yellow fluorescent protein (eYFP) and mCherry. Each fluorescent protein is tagged with a nuclear localization sequence (NLS) to aid in image analysis. The 3′ UTR of the mCherry gene is engineered to contain N binding sites for the miRNA mir-20. (b), Sample fluorescence microscopy data from representative single cells stably expressing eYFP and mCherry both in the presence and absence of regulation of mCherry by miR-20. The cells are arranged according to eYFP intensity. Scalebar is 5μm. (c), Transfer function relating eYFP to mCherry generated by binning according to eYFP intensity and plotting the mean mCherry in each bin. Supplementary Fig. 1 depicts a schematic of how the binning was performed on similarly structured flow cytometry data.
Figure 2
Figure 2
Biochemical model of miRNA-mediated gene regulation. (a), The model describes the steady state level of mRNA free to be translated (r), which we experimentally observe as the mCherry signal, subject to regulation by miRNA (m) as a function of bare transcriptional activity in the absence of regulation by miRNA (r0), which we experimentally observe as eYFP. The target mRNA is transcribed at a rate kR and intrinsically decays with rate γR. miRNA and mRNA bind with rate kon to form a complex (r*). The bound miRNA can re-enter the pool of active miRNA either by unbinding the target mRNA with rate koff, or destroying the mRNA with rate γr*. The steady state solution for r allows us to combine these microscopic parameters into two lumped parameters that govern the shape of the transfer function: λ, the effective dissociation constant characterizing the strength of the miRNA-mRNA interaction, and θ, proportional to the concentration of miRNA that acts on the target mRNA. (b), Steady state solutions for r as a function of r0 for various values of kon; increasing kon decreases λ. (c), Steady state solutions for r as a function of r0 for various values of [miRNA]total; increasing [miRNA]total increases θ. (d),(e) Same solutions as in (b) and (c) except depicted in log-log axes. The slope of the log-log curve is known as the logarithmic gain. Notably, thresholds in the linear representation appear as segments with logarithmic gain greater than 1 in the log-log representation. Increasing kon increases the maximum logarithmic gain, but does not change its position along the r0 axis, while increasing [miRNA]total increases the maximum logarithmic gain and shifts it to higher levels of r0. Blue dots in panels (b)-(e) are guides to the eye to facilitate comparison between linear and logarithmic plots.
Figure 3
Figure 3
Modulating the threshold. (a), Log-log transfer functions for N = 0, 1, 4, and 7. We can abolish the threshold by using a miR-20 binding site that is perfectly complementary to miR-20. (b), Ratio of N = 0 transfer function to N = 1, 4, and 7 transfer functions, depicting the fold repression as a function of eYFP expression. Inset depicts the average fold repression as a function of N. Using the flow cytometry data from panel (a), we compute the ratio of the mean eYFP level to the mean mCherry level for N = 1, 4, and 7. We then normalize this ratio by the mean eYFP to mean mCherry ratio for N = 0; we refer to this normalized ratio as the fold repression. Error bars are estimated by bootstrap sampling of the flow cytometry data. (c),(d) Effects of titrating defined amounts of miR-20 mimic siRNA on the transfer function for N = 4 (c) and N = 7 (d). In panels (a), (c), and (d) the angle symbol followed by a number denotes the value of the logarithmic gain, either minimum (when gain = 1) or maximum (when gain > 1).
Figure 4
Figure 4
(a),(b) Comparison to model. Following simultaneous fitting of all transfer function data to the quantitative model, the fitting parameter θ, proportional to the total amount of active miR-20 in the cell, is plotted against the amount of miR-20 mimic transfected (a); and 1/λ, proportional to the rate of mCherry-miR-20 association, is plotted against N (b).
Figure 5
Figure 5
Thresholding in endogenous 3′ UTRs. (a) The 3′ UTR of HMGA2 or a version with the seven let-7 seed matches mutated was fused to mCherry. The reporters were cotransfected with varying concentrations of let-7b mimic. Cells were assayed by flow cytometry 48hr post-transfection. (b) The 3′ UTR of SLC6A1, which contains three seed matches for miR-218, was fused to mCherry. The reporter was transfected with or without miR-218 mimic. Cells were assayed by flow cytometry 48hr post-transfection.

References

    1. Lewis BP, Burge CB, Bartel DP. Conserved seed pairing, often flanked by adenosines, indicates that thousands of human genes are microRNA targets. Cell. 2005;120:15–20. - PubMed
    1. Selbach M, et al. Widespread changes in protein synthesis induced by microRNAs. Nature. 2008;455:58–63. - PubMed
    1. Baek D, et al. The impact of microRNAs on protein output. Nature. 2008;455:64–71. - PMC - PubMed
    1. Friedman RC, Farh KK, Burge CB, Bartel DP. Most Mammalian mRNAs are conserved targets of microRNAs. Genome Res. 2009;19:92–105. - PMC - PubMed
    1. Lim LP, et al. The microRNAs of Caenorhabditis elegans. Genes Dev. 2003;17:991–1008. - PMC - PubMed

Publication types