

doi: 10.1016/j.jpubeco.2011.05.005.
The Impact of Research Grant Funding on Scientific Productivity
Affiliations
- PMID: 21857758
- PMCID: PMC3156466
- DOI: 10.1016/j.jpubeco.2011.05.005
Item in Clipboard
The Impact of Research Grant Funding on Scientific Productivity
J Public Econ.
.
Abstract
In this paper, we estimate the impact of receiving an NIH grant on subsequent publications and citations. Our sample consists of all applications (unsuccessful as well as successful) to the NIH from 1980 to 2000 for standard research grants (R01s). Both OLS and IV estimates show that receipt of an NIH research grant (worth roughly $1.7 million) leads to only one additional publication over the next five years, which corresponds to a 7 percent increase. The limited impact of NIH grants is consistent with a model in which the market for research funding is competitive, so that the loss of an NIH grant simply causes researchers to shift to another source of funding.
Figures

Relationship between Normalized Priority Score and Award Status Notes: Data is smoothed using a lowess estimator with a bandwidth of .03.

Relationship between Normalized Priority Score, Eventual Award, and Publication Residuals Notes: Data is smoothed using a lowess estimator with a bandwidth of .03. Publication residuals are calculated by regressing five year publication rates on researcher demographics and prior productivity measures.
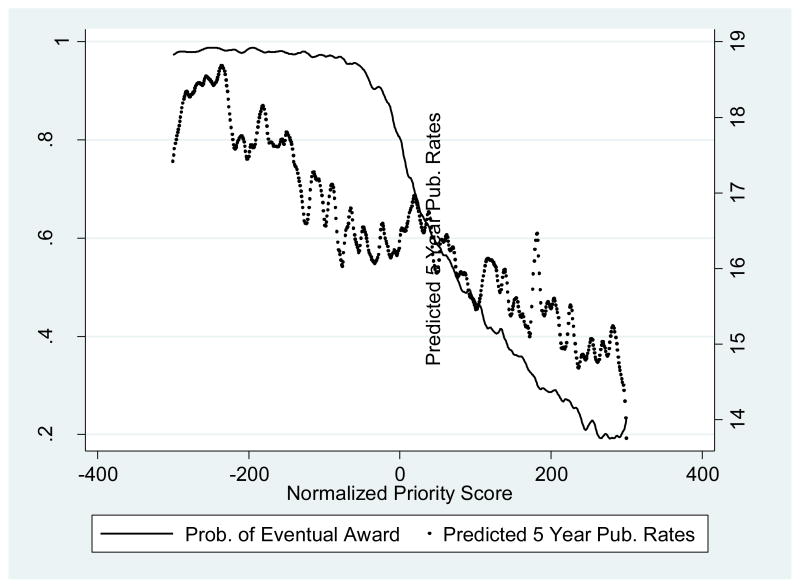
Relationship between Normalized Priority Score, Eventual Award, and Predicted Publication Rates Notes: Data is smoothed using a lowess estimator with a bandwidth of .03. Predicted publication rates are calculated by regressing five year publication rates on researcher demographics and prior productivity measures.
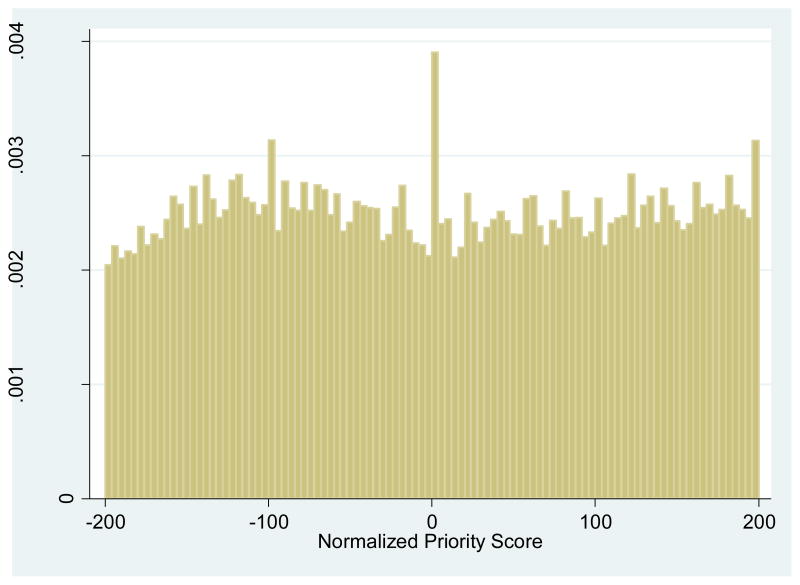
Histogram of Normalized Priority Scores Notes: The figure shows a histogram of normalized priority scores. The spike at zero is due to the fact that we define the cutoff empirically as the score of the application that would be funded if funding decisions were made in strict order according to priority score.
References
-
- Adams J, Griliches Z. Research productivity in a system of universities. Annals of INSEE. 1998:127–162.
-
- Angrist JD, Lavy V. Using maimonides rule to estimate the effect of class size on scholastic achievement. Quarterly Journal of Economics. 1999;114(2):535–575.
-
- Arora A, Gambardella A. The impact of NSF support for basic research in economics. Annales d’Economie et de Statistique. 2005:79–80. 91–117.
-
- Averch HA. Measuring the cost-efficiency of basic research investment: Input-output approaches. Journal of Policy Analysis and Management. 1987;6(3):342–361.
-
- Averch HA. Exploring the cost-efficiency of basic research funding in chemistry. Research Policy. 1989;18(3):165–172.
LinkOut - more resources
Full Text Sources
Other Literature Sources