. 2011:7:465-84.
doi: 10.2147/NDT.S23159. Epub 2011 Aug 11.

Moderate alcohol consumption and cognitive risk

Affiliations

Moderate alcohol consumption and cognitive risk

Edward J Neafsey et al. Neuropsychiatr Dis Treat. 2011.

Abstract

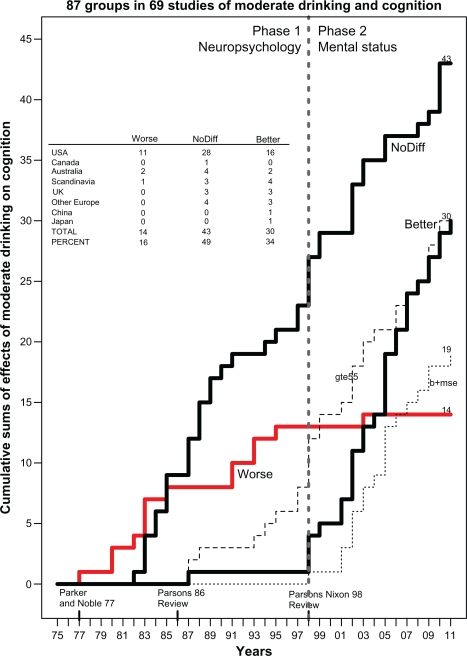
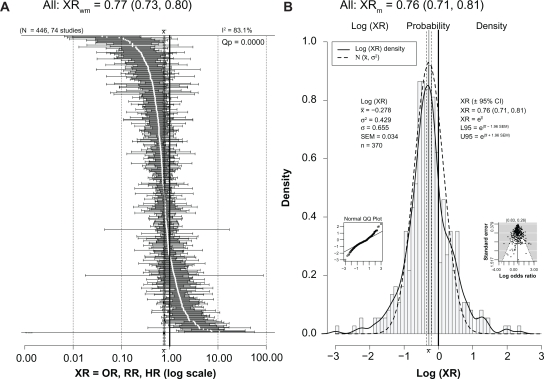
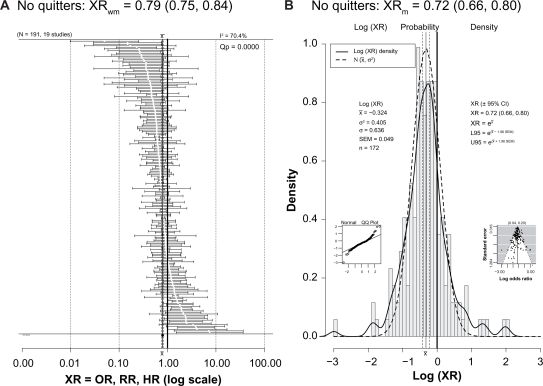
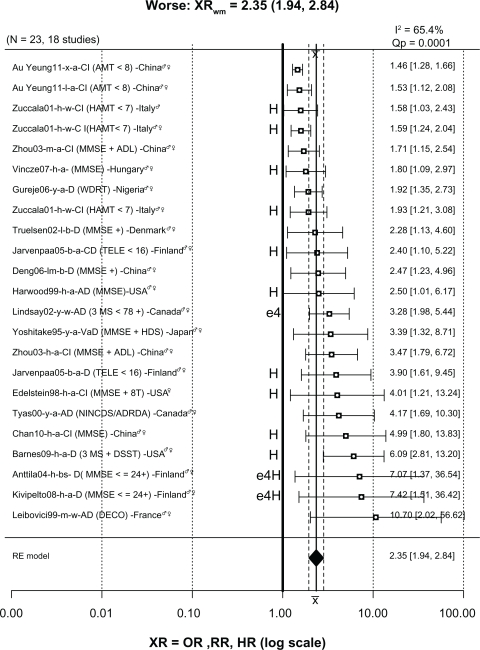
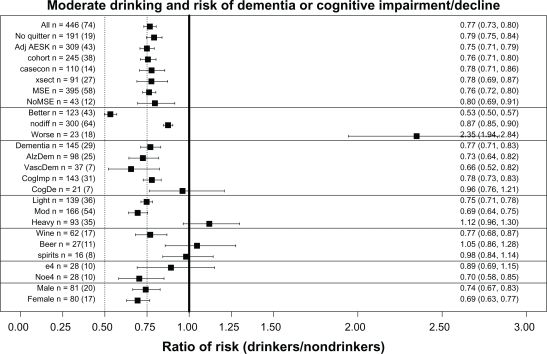
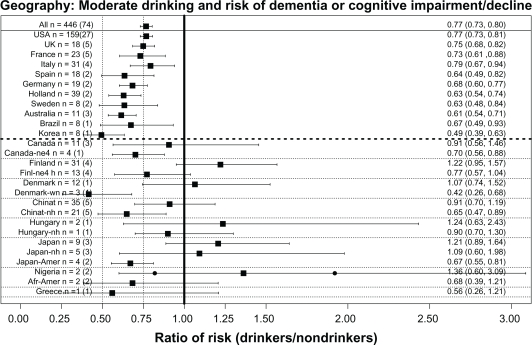
We reviewed 143 papers that described the relationship between moderate drinking of alcohol and some aspect of cognition. Two types of papers were found: (1) those that provided ratios of risk between drinkers and nondrinkers (74 papers in total) and (2) those that, although they did not provide such ratios, allowed cognition in drinkers to be rated as "better," "no different," or "worse" than cognition in nondrinkers (69 papers in total). The history of research on moderate drinking and cognition can be divided into two eras: 1977-1997 and 1998-present. Phase I (1977-1997) was the era of neuropsychological evaluation involving mostly young to middle-aged (18-50 years old) subjects. Although initial studies indicated moderate drinking impaired cognition, many later studies failed to confirm this, instead finding no difference in cognition between drinkers and nondrinkers. Phase II (1998-present) was and is the era of mental status exam evaluation involving mostly older (≥55 years old) subjects. These studies overwhelmingly found that moderate drinking either reduced or had no effect on the risk of dementia or cognitive impairment. When all the ratios of risk from all the studies in phase II providing such ratios are entered into a comprehensive meta-analysis, the average ratio of risk for cognitive risk (dementia or cognitive impairment/decline) associated with moderate "social" (not alcoholic) drinking of alcohol is 0.77, with nondrinkers as the reference group. The benefit of moderate drinking applied to all forms of dementia (dementia unspecified, Alzheimer's disease, and vascular dementia) and to cognitive impairment (low test scores), but no significant benefit against cognitive decline (rate of decline in test scores) was found. Both light and moderate drinking provided a similar benefit, but heavy drinking was associated with nonsignificantly higher cognitive risk for dementia and cognitive impairment. Although the meta-analysis also indicated that wine was better than beer or spirits, this was based on a relatively small number of studies because most studies did not distinguish among these different types of alcohol. Furthermore, a number of the studies that did make the distinction reported no difference among the effects of these different types of alcohol. Therefore, at present this question remains unanswered. Analysis also showed that the presence of the apolipoprotein E epsilon 4 allele eliminated the benefit of moderate drinking. However, this was based on a relatively small number of studies and several other studies have found a beneficial effect of the epsilon e4 allele. Further studies are necessary to settle this question. The benefit of moderate alcohol for cognition was seen in both men and women, although the amount and pattern of drinking is very different between the two sexes. Lastly, the finding of unaffected or significantly reduced cognitive risk in light to moderate drinkers was seen in 14/19 countries for which country-specific ratio data were available, with three of the five remaining countries showing nonsignificant reductions as well. Overall, light to moderate drinking does not appear to impair cognition in younger subjects and actually seems to reduce the risk of dementia and cognitive decline in older subjects.

Keywords: Alzheimer’s disease; dementia; drinking.


Figures

Figure 1
Figure 1
Cumulative sum histograms (heavy lines) of numbers of studies that did not report various ratios or risk but instead reported “Worse” (heavy solid gray line), “NoDiff” (left, heavy solid black line), or “Better” (right, heavy solid black line) cognition in “social” drinkers (not alcoholics) versus nondrinkers from 1975 to 2011. Thin dotted line at the lower right plots the cumulative sum histogram for studies that reported better cognition and used a MSE to evaluate cognition (b+mse). Thin dashed line plots the cumulative sum histogram for studies of subjects who were ≥55 years of age (gte55). Dashed vertical line at 1998 separates two phases of research on this question (phase I: neuropsychology; phase II: mental status). Inset table shows the breakdown by country of studies reporting worse, no different, or better cognition in drinkers. Abbreviations: CI, confidence interval; b, better; ge55, ≥55 years of age; HR, hazard ratio; MSE, mental status exam; NoDiff, no different; OR, odds ratio; RR, risk ratio; UK, United Kingdom; USA, United States of America.
Figure 2
Figure 2
(A) Forest plot of all 446 XRs (white dots) plus or minus their 95% CIs (horizontal “whiskers”) from 74 studies providing ratios; ratios are listed in order from smallest to largest. XRwm is the weighted (wt = 1/SEM2) mean of all 446 ratios from a random-effects meta-analysis model with 95% CI in parentheses. Mean value ±95% CI is to the left of and significantly less than the thick solid vertical line at 1.00 that denotes no difference; this value indicated on the plot’s x axis with ±95% CI (vertical dashed lines). (B) Histogram of the probability density of the log(XR) values with a superimposed smooth probability density curve (solid line) and a superimposed normal distribution density curve (dashed line) calculated using the mean and variance of log(XR). XRm is the simple (not weighted) antilog of the mean of all log(XR) values with the 95% CI in parentheses; this value indicated on the plot’s x axis with ±95% CI (vertical dashed lines). Small inset graph on left is a normal Q–Q plot showing normality and departures from normality of the log(XR) distribution. Small inset graph on right is funnel plot with P-values for regression (left) and rank correlation (right) tests for asymmetry across top. Note that XRm is identical to XRwm. Abbreviations: CI, confidence interval; HR, hazard ratio; NoQuitters, no quitters; OR, odds ratio; Q–Q, quantile–quantile; RR, risk ratio; SEM, standard error of the mean; wt, weight; XRs, hazard ratios, odds ratios, and risk ratios; XRwm, weighted mean ratio.
Figure 3
Figure 3
(A) Forest plot of 191 XRs (white dots) plus or minus their 95% CIs (horizontal “whiskers”) from 19 studies providing ratios with a reference group that did not include former drinkers. (B) Histogram of the probability density of the log(XR) values with a superimposed smooth probability density curve (solid line) and a superimposed normal distribution density curve (dashed line) calculated using the mean and variance of log(XR). Notes: The XRwm in Figure 3A is close to that seen in Figure 2. Other conventions are as for Figure 2. Abbreviations: CI, confidence interval; HR, hazard ratio; NoQuitters, no quitters; OR, odds ratio; Q–Q, quantile–quantile; RR, risk ratio; SEM, standard error of the mean; XRs, hazard ratios, odds ratios, and risk ratios; XRwm, weighted mean ratio.
Figure 4
Figure 4
Forest plot of 23 XRs plus or minus their 95% CIs (horizontal “whiskers”) from 18 studies providing ratios where drinkers were significantly worse than nondrinkers. Notes: Uppercase “H” at left of vertical reference line at 1 indicates ratios from heavy drinkers; “e4” indicates presence of apolipoprotein E epsilon 4 allele. Other conventions as in Figure 2A. Note that the XRwm of 2.43 (95% CI: 1.95–3.03) is much larger than that seen in Figure 2 and is significantly greater than 1. Abbreviations: ♀, female; ♂, male; 3MS, Modified Mini-Mental State examination; 8t, 8 additional tests; AD, Alzheimer’s disease; ADL, Activities of Daily Living; AMT, Abbreviated Mental Test; CI, confidence interval; D, dementia; DECO, Deterioration Cognitive Observee test; DSST, Digit Symbol Substitution Test; HAMT, Hodkinson Abbreviated Mental Test; HR, hazard ratio; MMSE, Mini-Mental State Examination; MSE, mental status exam; NINCDS/ADRDA, National Institute of Neurological Communicative Disorders and Stroke/Alzheimer’s Disease and Related Disorders Association criteria for AD; NoDiff, no different; OR, odds ratio; RR, risk ratio; TELE, telephone screen for cognitive impairment; WDRT, Word Delay Recall Test; XRs, hazard ratios, odds ratios, and risk ratios; XRwm, weighted mean ratio.
Figure 5
Figure 5
Overall weighted mean ratios (XRwm) comparing cognitive function in drinkers and nondrinkers in the various groups analyzed. Group with number of ratios (number of studies) indicated on left; XRwm (95% confidence interval) given on right. Note: See text for fuller description. Abbreviations: AdjAESK, Adjusted for Age, Education, Sex, and Smoking; AlzDem, Alzheimer’s disease; casecon, case-control study; CogDec, cognitive decline; CogImp, cognitive improvement; e4, epsilon 4; heavy, heavy drinkers; light, light drinkers; mod, moderate drinkers; MSE, mental status exam; nodiff, no different; Noe4, no epsilon 4; NoMSE, no mental status exam; Noquitter, no quitters; VascDem, vascular dementia; XR, hazard ratio, odds ratio, and risk ratio; XRwm, weighted mean ratio; xsect, cross-sectional study.
Figure 6
Figure 6
Overall weighted mean ratios (XRwm) comparing cognitive risk in drinkers and nondrinkers by country. Country with number of ratios (number of studies) indicated on left; XRwm (95% confidence interval) given on right. Abbreviations: afr-amer, African-Americans; australia, Australia; brazil, Brazil; canada, Canada; canada-ne4, Canada, no epsilon 4; chinat, China and Taiwan; chinat-nh, China and Taiwan, no heavy drinkers; denmark, Denmark; denmark-wn, Denmark, wine drinkers; finland, Finland; finl-ne4h, Finland, no epsilon 4, no heavy drinkers; france, France; germany, Germany; greece, Greece; holland, the Netherlands; hungary, Hungary; hungary-nh, Hungary, no heavy drinkers; italy, Italy; japan, Japan; japan-amer, Japanese Americans; japan-nh, Japan, no heavy drinkers; korea, Korea; nigeria, Nigeria; spain, Spain; sweden, Sweden; UK, United Kingdom; USA, United States of America; XR, hazard ratio, odds ratio, and risk ratio.

Similar articles

Cited by

References

    1. Belmadani A, Kumar S, Schipma M, et al. Inhibition of amyloid-beta-induced neurotoxicity and apoptosis by moderate ethanol preconditioning. Neuroreport. 2004;15:2093–2096. - PubMed
    1. Golde TE. Alzheimer disease therapy: can the amyloid cascade be halted? J Clin Invest. 2003;111:11–18. - PMC - PubMed
    1. Collins MA, Neafsey EJ, Mukamal KJ, et al. Alcohol in moderation, cardioprotection, and neuroprotection: epidemiological considerations and mechanistic studies. Alcohol Clin Exp Res. 2009;33:206–219. - PMC - PubMed
    1. Collins MA, Neafsey EJ, Wang K, et al. Moderate ethanol preconditioning of rat brain cultures engenders neuroprotection against dementia-inducing neuroinflammatory proteins: possible signaling mechanisms. Mol Neurobiol. 2010;41:420–425. - PMC - PubMed
    1. Mitchell RM, Neafsey EJ, Collins MA. Essential involvement of the NMDA receptor in ethanol preconditioning-dependent neuroprotection from amyloid-beta in vitro. J Neurochem. 2009;111:580–588. - PMC - PubMed