

Population genetics of an ecosystem-defining reef coral Pocillopora damicornis in the Tropical Eastern Pacific
- PMID: 21857900
- PMCID: PMC3153452
- DOI: 10.1371/journal.pone.0021200
Population genetics of an ecosystem-defining reef coral Pocillopora damicornis in the Tropical Eastern Pacific
Abstract
Background: Coral reefs in the Tropical Eastern Pacific (TEP) are amongst the most peripheral and geographically isolated in the world. This isolation has shaped the biology of TEP organisms and lead to the formation of numerous endemic species. For example, the coral Pocillopora damicornis is a minor reef-builder elsewhere in the Indo-West Pacific, but is the dominant reef-building coral in the TEP, where it forms large, mono-specific stands, covering many hectares of reef. Moreover, TEP P. damicornis reproduces by broadcast spawning, while it broods mostly parthenogenetic larvae throughout the rest of the Indo-West Pacific. Population genetic surveys for P. damicornis from across its Indo-Pacific range indicate that gene flow (i.e. larval dispersal) is generally limited over hundreds of kilometers or less. Little is known about the population genetic structure and the dispersal potential of P. damicornis in the TEP.
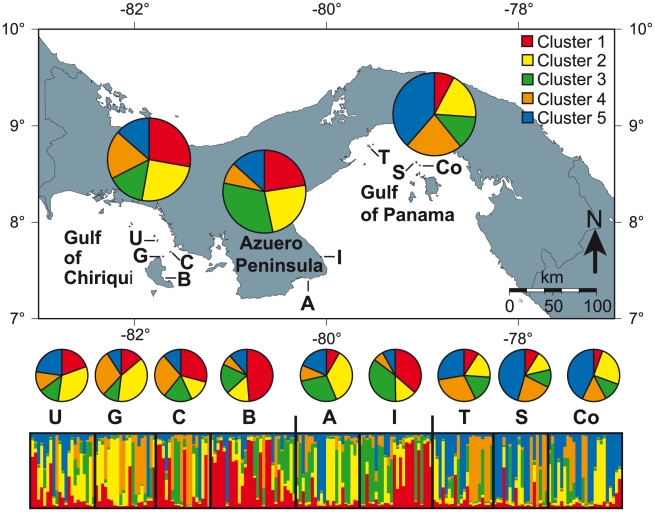
Methodology: Using multilocus microsatellite data, we analyzed the population structure of TEP P. damicornis among and within nine reefs and test for significant genetic structure across three geographically and ecologically distinct regions in Panama.
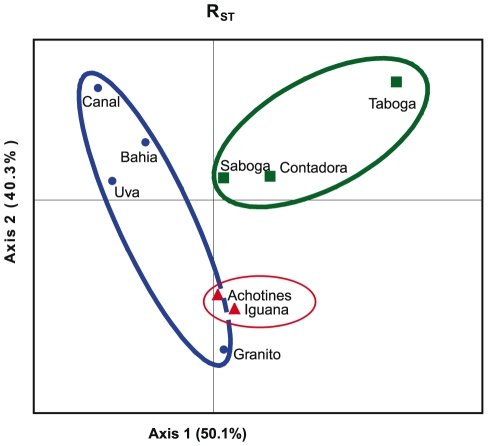
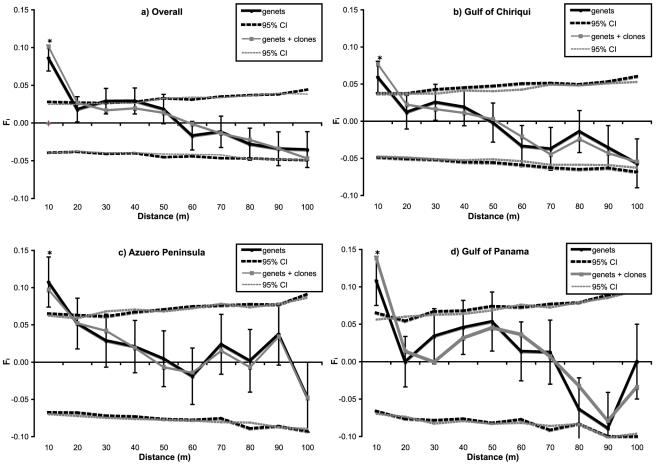
Principal findings/conclusions: We detected significant levels of population genetic structure (global R(ST) = 0.162), indicating restricted gene flow (i.e. larvae dispersal), both among the three regions (R(RT) = 0.081) as well as within regions (R(SR) = 0.089). Limited gene flow across a distinct environmental cline, like the regional upwelling gradient in Panama, indicates a significant potential for differential adaptation and population differentiation. Individual reefs were characterized by unexpectedly high genet diversity (avg. 94%), relatively high inbreeding coefficients (global F(IS) = 0.183), and localized spatial genetic structure among individuals (i.e. unique genets) over 10 m intervals. These findings suggest that gene flow is limited in TEP P. damicornis populations, particularly among regions, but even over meter scales within populations.
Conflict of interest statement
Figures
Similar articles
-
Interspecific hybridization and restricted trans-Pacific gene flow in the Tropical Eastern Pacific Pocillopora.Mol Ecol. 2008 Mar;17(5):1304-12. doi: 10.1111/j.1365-294X.2007.03672.x. Mol Ecol. 2008. PMID: 18302690
-
Protection of genetic diversity and maintenance of connectivity among reef corals within marine protected areas.Conserv Biol. 2008 Oct;22(5):1245-54. doi: 10.1111/j.1523-1739.2008.00985.x. Epub 2008 Jul 15. Conserv Biol. 2008. PMID: 18637917
-
Genetic relatedness does not retain spatial pattern across multiple spatial scales: dispersal and colonization in the coral, Pocillopora damicornis.Mol Ecol. 2013 Jul;22(14):3721-36. doi: 10.1111/mec.12335. Epub 2013 Jun 20. Mol Ecol. 2013. PMID: 23786173
-
Population genetics assessment of two pocilloporid coral species from the northern red sea: Implications for urbanized reef sustainability.Mar Environ Res. 2024 Jul;199:106580. doi: 10.1016/j.marenvres.2024.106580. Epub 2024 Jun 3. Mar Environ Res. 2024. PMID: 38851082
-
History of perspectives on the study of coral disease in the eastern tropical Pacific.Dis Aquat Organ. 2019 Nov 14;136(3):243-253. doi: 10.3354/dao03411. Dis Aquat Organ. 2019. PMID: 31724557 Review.
Cited by
-
Species and population genomic differentiation in Pocillopora corals (Cnidaria, Hexacorallia).Genetica. 2022 Oct;150(5):247-262. doi: 10.1007/s10709-022-00165-7. Epub 2022 Sep 9. Genetica. 2022. PMID: 36083388
-
Strong trans-Pacific break and local conservation units in the Galapagos shark (Carcharhinus galapagensis) revealed by genome-wide cytonuclear markers.Heredity (Edinb). 2018 May;120(5):407-421. doi: 10.1038/s41437-017-0025-2. Epub 2018 Jan 11. Heredity (Edinb). 2018. PMID: 29321624 Free PMC article.
-
Rarity and genetic diversity in Indo-Pacific Acropora corals.Ecol Evol. 2012 Aug;2(8):1867-88. doi: 10.1002/ece3.304. Epub 2012 Jul 6. Ecol Evol. 2012. PMID: 22957189 Free PMC article.
-
Population genetic differentiation of the ubiquitous brooding coral Pocillopora acuta along Phuket Island reefs in the Andaman Sea, Thailand.BMC Ecol Evol. 2023 Aug 26;23(1):42. doi: 10.1186/s12862-023-02153-7. BMC Ecol Evol. 2023. PMID: 37626296 Free PMC article.
-
High flow conditions mediate damaging impacts of sub-lethal thermal stress on corals' endosymbiotic algae.Conserv Physiol. 2021 Jun 24;9(1):coab046. doi: 10.1093/conphys/coab046. eCollection 2021. Conserv Physiol. 2021. PMID: 34188937 Free PMC article.
References
-
- Soule M. The epistasis cycle: a theory of marginal populations. Annual Review of Ecology and Systematics. 1973;4:165–187.
-
- Brown J, Stevens G, Kaufman D. The geographic range: size, shape, boundaries, and internal structure. Annual Review of Ecology and Systematics. 1996;27:597–623.
-
- Vucetich J, Waite T. Spatial patterns of demography and genetic processes across the species' range: null hypotheses for landscape conservation genetics. Conservation Genetics. 2003;4:639–645.
-
- Slatkin M. Gene flow and the geographic structure of natural populations. Science. 1987;236:787. - PubMed
-
- Garcia-Ramos G, Kirkpatrick M. Genetic models of adaptation and gene flow in peripheral populations. Evolution. 1997;51:21–28. - PubMed
Publication types
MeSH terms
LinkOut - more resources
Full Text Sources
Research Materials
