

High-resolution measurements of face-to-face contact patterns in a primary school
- PMID: 21858018
- PMCID: PMC3156713
- DOI: 10.1371/journal.pone.0023176
High-resolution measurements of face-to-face contact patterns in a primary school
Abstract
Background: Little quantitative information is available on the mixing patterns of children in school environments. Describing and understanding contacts between children at school would help quantify the transmission opportunities of respiratory infections and identify situations within schools where the risk of transmission is higher. We report on measurements carried out in a French school (6-12 years children), where we collected data on the time-resolved face-to-face proximity of children and teachers using a proximity-sensing infrastructure based on radio frequency identification devices.
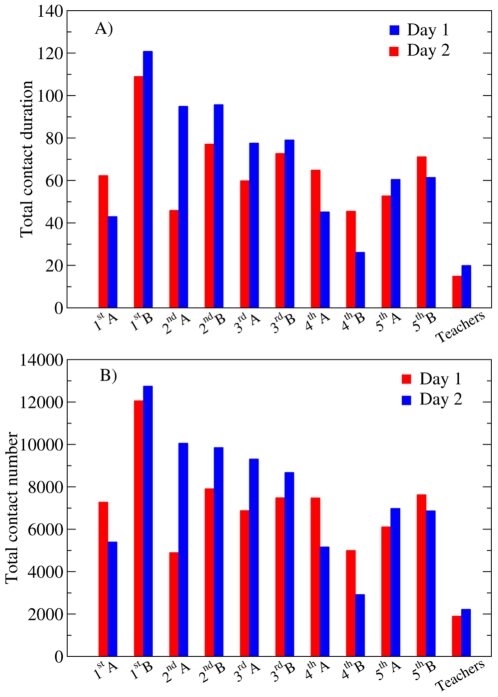
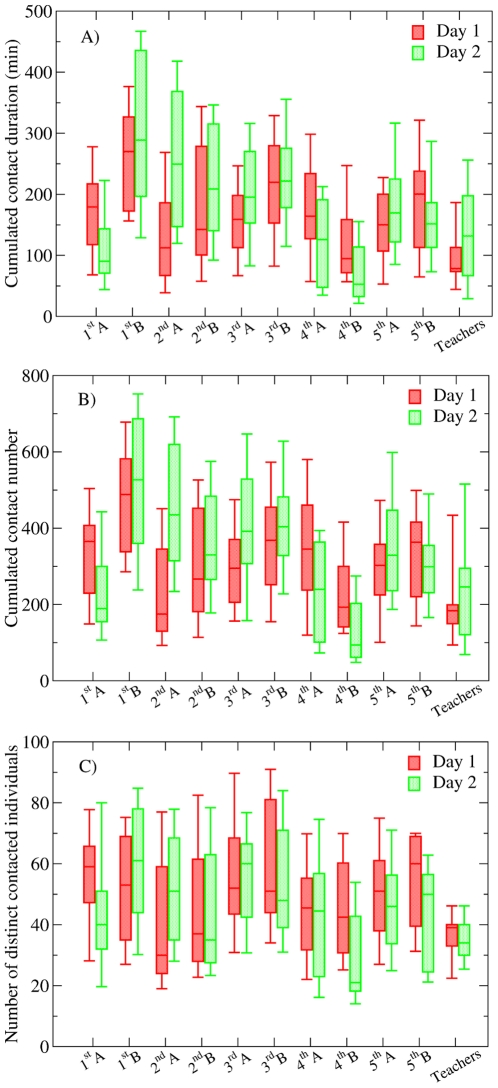
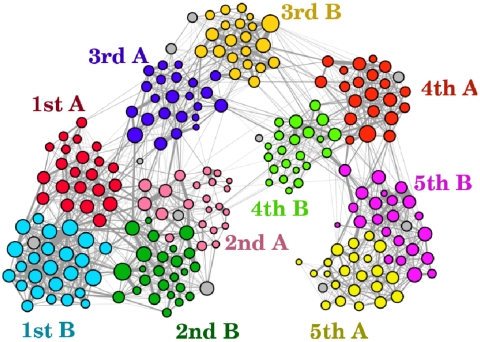
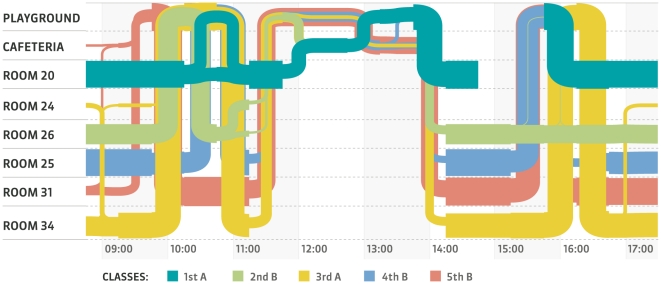
Methods and findings: Data on face-to-face interactions were collected on Thursday, October 1(st) and Friday, October 2(nd) 2009. We recorded 77,602 contact events between 242 individuals (232 children and 10 teachers). In this setting, each child has on average 323 contacts per day with 47 other children, leading to an average daily interaction time of 176 minutes. Most contacts are brief, but long contacts are also observed. Contacts occur mostly within each class, and each child spends on average three times more time in contact with classmates than with children of other classes. We describe the temporal evolution of the contact network and the trajectories followed by the children in the school, which constrain the contact patterns. We determine an exposure matrix aimed at informing mathematical models. This matrix exhibits a class and age structure which is very different from the homogeneous mixing hypothesis.
Conclusions: We report on important properties of the contact patterns between school children that are relevant for modeling the propagation of diseases and for evaluating control measures. We discuss public health implications related to the management of schools in case of epidemics and pandemics. Our results can help define a prioritization of control measures based on preventive measures, case isolation, classes and school closures, that could reduce the disruption to education during epidemics.
Conflict of interest statement
Figures
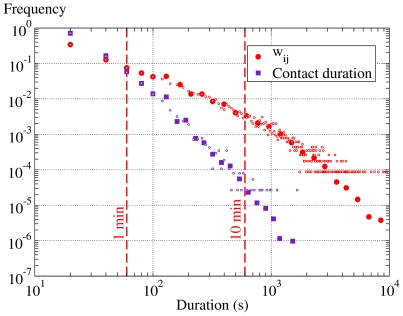
 ). 88% of the contacts last less than 1 minute, but more than 0.2% last more than 5 minutes. For the cumulated durations, 64% of the total duration of contacts between two individuals during one day last less than 2 minutes, but 9% last more than 10 minutes and 0.38% more than 1 hour. The small symbols correspond to the original distributions, and the large symbols to the log-binned distributions.
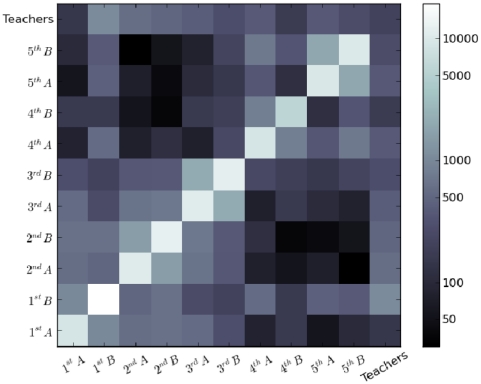
 ) measured between individuals of classes A and B over the two days of data collection. A logarithmic grayscale is used to compress the dynamic range of the matrix entries and enhance the off-diagonal hierarchical structure.
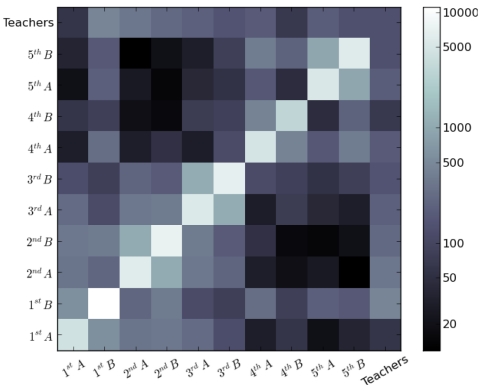
 , in minutes) of contacts measured between individuals of classes A and B over the two days of data gathering. A logarithmic grayscale is used to compress the dynamic range of the matrix entries and enhance the off-diagonal hierarchical structure.
References
-
- Longini IM, Jr, Koopman JS, Monto AS, Fox JP. Estimating household and community transmission parameters for influenza. Am J Epidemiol. 1982;115(5):736–51. - PubMed
Publication types
MeSH terms
LinkOut - more resources
Full Text Sources
