. 2011;6(8):e23210.
doi: 10.1371/journal.pone.0023210. Epub 2011 Aug 12.

Successful in vitro expansion and differentiation of cord blood derived CD34+ cells into early endothelial progenitor cells reveals highly differential gene expression

Affiliations

Successful in vitro expansion and differentiation of cord blood derived CD34+ cells into early endothelial progenitor cells reveals highly differential gene expression

Ingo Ahrens et al. PLoS One. 2011.

Abstract

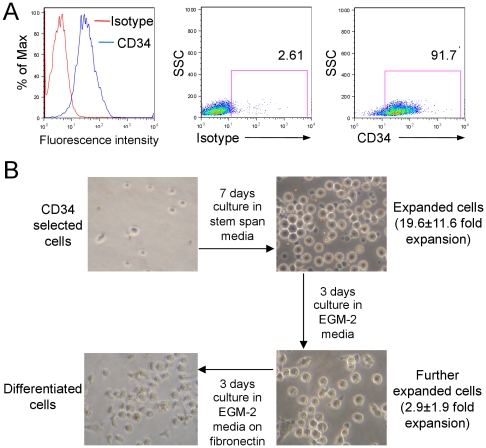
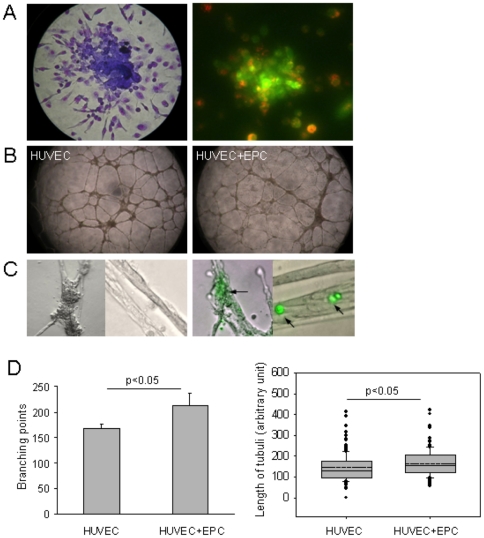
Endothelial progenitor cells (EPCs) can be purified from peripheral blood, bone marrow or cord blood and are typically defined by a limited number of cell surface markers and a few functional tests. A detailed in vitro characterization is often restricted by the low cell numbers of circulating EPCs. Therefore in vitro culturing and expansion methods are applied, which allow at least distinguishing two different types of EPCs, early and late EPCs. Herein, we describe an in vitro culture technique with the aim to generate high numbers of phenotypically, functionally and genetically defined early EPCs from human cord blood. Characterization of EPCs was done by flow cytometry, immunofluorescence microscopy, colony forming unit (CFU) assay and endothelial tube formation assay. There was an average 48-fold increase in EPC numbers. EPCs expressed VEGFR-2, CD144, CD18, and CD61, and were positive for acetylated LDL uptake and ulex lectin binding. The cells stimulated endothelial tube formation only in co-cultures with mature endothelial cells and formed CFUs. Microarray analysis revealed highly up-regulated genes, including LL-37 (CAMP), PDK4, and alpha-2-macroglobulin. In addition, genes known to be associated with cardioprotective (GDF15) or pro-angiogenic (galectin-3) properties were also significantly up-regulated after a 72 h differentiation period on fibronectin. We present a novel method that allows to generate high numbers of phenotypically, functionally and genetically characterized early EPCs. Furthermore, we identified several genes newly linked to EPC differentiation, among them LL-37 (CAMP) was the most up-regulated gene.


Conflict of interest statement

Competing Interests: The authors have declared that no competing interests exist.

Figures

Figure 1
Figure 1. Isolation, expansion and differentiation of cord blood derived CD34+ HPCs.
A. A representative histogram and dot plots showing CD34-expression after purification from cord blood depicted as fluorescence intensity values and percentage of CD34+ cells compared to the corresponding isotype control, respectively. B. The morphology and culture procedure for CD34+ cells after purification, seven days in expansion media, three days in medium and another three days in EGM-2 on fibronectin coated dishes. The fold expansion of cells represent mean and SD of n = 9.
Figure 2
Figure 2. Phenotypical characterisation of expanded HPC derived early EPCs.
A. Binding of ulex-lectin and uptake of acetylated LDL (AcLDL) on EPCs visualised with fluorescence microscopy and flow cytometry using FITC-labelled ulex-lectin and Dil-labelled acetylated LDL, respectively. B. Summary of median fluorescence intensity for CD34-FITC, CD61-FITC, CD144-PE, CD309-PE, CD45-FITC and CD18-FITC of five donors expressed as mean and SD compensated for respective isotype control. C. Representative histograms comparing fluorescence intensity on early EPCs and HUVECs of the cell surface markers for CD34, CD61, CD144, CD309, CD45 and CD18 (blue line) and corresponding isotype control (red line).
Figure 3
Figure 3. Functional characterization of putative early EPCs.
A. A representative colony forming unit (CFU-Hill) visualised with giemsa staining and characterised with binding of FITC-labelled ulex-lectin and uptake of Dil-labelled acetylated LDL. B. Representative images of capillary network formed in a endothelial tube formation matrigel assay by HUVECs alone or HUVECs co-cultured with early EPCs. C Early EPCs pre-stained with cell tracker green (arrows) traced along the tubuli and in the branching area of capillary network D. The bar graph shows the total number of branching points (mean and SD, n = 3) and the box plot show the length of tubuli (dotted line represents the mean and the solid line represents the median, n = 488) in the endothelial tube formation matrigel with HUVECs alone or HUVECs co-cultured with early EPCs.
Figure 4
Figure 4. Adhesion of early EPCs to endothelial cells during static conditions and dynamic flow conditions.
Adhesion of early EPCs (pre-stained with cell tracker green) to endothelial cells (HUVECs), which are pre-incubated with or without TNFα(10 ng/ml) for one h. A. Number of adhering early EPCs to HUVECs after one h of static adhesion assay (mean and SD of n = 3). B. Immunofluorescence microscopy of one h static adhesion assay of early EPCs (green) adhered to HUVECs that had been pre-incubated with or without TNFα (10 ng/ml). C. A representative flow chamber experiment where the bar graph shows the number of adherent cells after three minutes of flow perfusion (50 s−1) of early EPCs into a capillary coated with HUVECs. Mean and SD of n = 3.
Figure 5
Figure 5. Gene expression profiling before and after 72 hour differentiation on fibronectin.
A. Principal Component analysis (PCA), an exploratory multivariate statistical technique was used to simplify the complex microarray changes that occur in three individuals (patient 10, 18 and 20) during 72 hours on fibronectin. This is done by reducing the dimensionality of the data matrix by finding r new variables (that sum the expression of multiple genes into single axes), shown here are the average signal of each sample along the three dimensional virtual space of the first three principal components. B and C. The box-and-whisker plot describing the distribution of feature intensities. The x-axis represents the individual microarray, while the y-axis represents the feature intensity values. Boxes represent the interquartile range, with the 75th percentile at the top and the 25th percentile at the bottom. The line in the middle of the box represents the 50th percentile, or median, while the plus represents the mean. Whiskers represent the rest of the distribution, with their terminations representing the lowest and highest feature intensity values. Box-and-whisker plots were performed for genes from the gene ontology term “Cell cycle and Proliferation” (B) and “adult stem cell” (C). D. Hierarchical Clustering of 466 differentially expressed genes, plotted according to their degree of respective co-expression. Columns represent samples, while rows represent genes. Gene ontology terms that are tightly co-expressed are listed on the right panel of the cluster. The origins of the sample (time point and patient donor) are listed on the bottom. The degree of correlation between genes (left) or samples (top) are plotted in a tree view fashion.
Figure 6
Figure 6. Selection of highly differentially expressed genes and their respective fold change in response to 72 hours of culture on fibronectin.
Validation of gene expression by quantitative real time PCR. The mean triplicate gene expression was obtained using differences in cycle threshold between the gene and 18 s (ΔCt). The fold change in difference (ΔΔCt) in gene expression in the compared samples before and after 72 hours culture on fibronectin was determined (2ΔΔCt) and expressed in the diagram as mean and SEM of n = 3.
Figure 7
Figure 7. Expression of LL-37 (CAMP) after 72 hours of culture on fibronectin.
Depicted is the intracellular protein expression of LL-37 (CAMP) in native cells before (left dot blot) and after (right dot plot) the 72 h differentiation period on fibronectin coated dishes detected by flow cytometry.

Similar articles

Cited by

References

    1. Asahara T, Murohara T, Sullivan A, Silver M, van der Zee R, et al. Isolation of putative progenitor endothelial cells for angiogenesis. Science. 1997;275:964–967. - PubMed
    1. Dimmeler S. Regulation of bone marrow-derived vascular progenitor cell mobilization and maintenance. Arterioscler Thromb Vasc Biol. 2010;30:1088–1093. - PubMed
    1. Hirschi KK, Ingram DA, Yoder MC. Assessing identity, phenotype, and fate of endothelial progenitor cells. Arterioscler Thromb Vasc Biol. 2008;28:1584–1595. - PMC - PubMed
    1. Hristov M, Erl W, Weber PC. Endothelial progenitor cells: mobilization, differentiation, and homing. Arterioscler Thromb Vasc Biol. 2003;23:1185–1189. - PubMed
    1. Jujo K, Ii M, Losordo DW. Endothelial progenitor cells in neovascularization of infarcted myocardium. J Mol Cell Cardiol. 2008;45:530–544. - PMC - PubMed

Publication types

MeSH terms