Common minor histocompatibility antigen discovery based upon patient clinical outcomes and genomic data
- PMID: 21858034
- PMCID: PMC3153501
- DOI: 10.1371/journal.pone.0023217
Common minor histocompatibility antigen discovery based upon patient clinical outcomes and genomic data
Abstract
Background: Minor histocompatibility antigens (mHA) mediate much of the graft vs. leukemia (GvL) effect and graft vs. host disease (GvHD) in patients who undergo allogeneic stem cell transplantation (SCT). Therapeutic decision making and treatments based upon mHAs will require the evaluation of multiple candidate mHAs and the selection of those with the potential to have the greatest impact on clinical outcomes. We hypothesized that common, immunodominant mHAs, which are presented by HLA-A, B, and C molecules, can mediate clinically significant GvL and/or GvHD, and that these mHAs can be identified through association of genomic data with clinical outcomes.
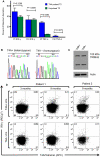
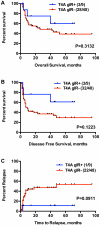
Methodology/principal findings: Because most mHAs result from donor/recipient cSNP disparities, we genotyped 57 myeloid leukemia patients and their donors at 13,917 cSNPs. We correlated the frequency of genetically predicted mHA disparities with clinical evidence of an immune response and then computationally screened all peptides mapping to the highly associated cSNPs for their ability to bind to HLA molecules. As proof-of-concept, we analyzed one predicted antigen, T4A, whose mHA mismatch trended towards improved overall and disease free survival in our cohort. T4A mHA mismatches occurred at the maximum theoretical frequency for any given SCT. T4A-specific CD8+ T lymphocytes (CTLs) were detected in 3 of 4 evaluable post-transplant patients predicted to have a T4A mismatch.
Conclusions/significance: Our method is the first to combine clinical outcomes data with genomics and bioinformatics methods to predict and confirm a mHA. Refinement of this method should enable the discovery of clinically relevant mHAs in the majority of transplant patients and possibly lead to novel immunotherapeutics.
Conflict of interest statement
Figures


Similar articles
-
Computational modeling and confirmation of leukemia-associated minor histocompatibility antigens.Blood Adv. 2018 Aug 28;2(16):2052-2062. doi: 10.1182/bloodadvances.2018022475. Blood Adv. 2018. PMID: 30115642 Free PMC article.
-
Shared graft-versus-leukemia minor histocompatibility antigens in DISCOVeRY-BMT.Blood Adv. 2023 May 9;7(9):1635-1649. doi: 10.1182/bloodadvances.2022008863. Blood Adv. 2023. PMID: 36477467 Free PMC article.
-
Diverse patterns of T-cell response against multiple newly identified human Y chromosome-encoded minor histocompatibility epitopes.Clin Cancer Res. 2010 Mar 1;16(5):1642-51. doi: 10.1158/1078-0432.CCR-09-2701. Epub 2010 Feb 16. Clin Cancer Res. 2010. PMID: 20160060 Free PMC article.
-
New developments in allotransplant immunology.Hematology Am Soc Hematol Educ Program. 2003:350-71. doi: 10.1182/asheducation-2003.1.350. Hematology Am Soc Hematol Educ Program. 2003. PMID: 14633790 Review.
-
Minor histocompatibility antigens in human stem cell transplantation.Exp Hematol. 2003 Sep;31(9):743-51. doi: 10.1016/s0301-472x(03)00190-5. Exp Hematol. 2003. PMID: 12962719 Review.
Cited by
-
Determining the Quantitative Principles of T Cell Response to Antigenic Disparity in Stem Cell Transplantation.Front Immunol. 2018 Oct 11;9:2284. doi: 10.3389/fimmu.2018.02284. eCollection 2018. Front Immunol. 2018. PMID: 30364159 Free PMC article. Review.
-
Adoptive T-cell therapy for Leukemia.Mol Cell Ther. 2014 Aug 12;2:25. doi: 10.1186/2052-8426-2-25. eCollection 2014. Mol Cell Ther. 2014. PMID: 26056592 Free PMC article. Review.
-
Role of Pharmacogenetics in Hematopoietic Stem Cell Transplantation Outcome in Children.Int J Mol Sci. 2015 Aug 10;16(8):18601-27. doi: 10.3390/ijms160818601. Int J Mol Sci. 2015. PMID: 26266406 Free PMC article. Review.
-
The delicate balance of graft versus leukemia and graft versus host disease after allogeneic hematopoietic stem cell transplantation.Expert Rev Hematol. 2023 Jul-Dec;16(12):943-962. doi: 10.1080/17474086.2023.2273847. Epub 2023 Dec 18. Expert Rev Hematol. 2023. PMID: 37906445 Free PMC article. Review.
-
Minor histocompatibility Ags: identification strategies, clinical results and translational perspectives.Bone Marrow Transplant. 2016 Feb;51(2):163-71. doi: 10.1038/bmt.2015.256. Epub 2015 Oct 26. Bone Marrow Transplant. 2016. PMID: 26501766 Review.
References
-
- Falkenburg JH, van de Corput L, Marijt EW, Willemze R. Minor histocompatibility antigens in human stem cell transplantation. Exp Hematol. 2003;31:743–751. - PubMed
-
- Gale RP, Horowitz MM, Ash RC, Champlin RE, Goldman JM, et al. Identical-twin bone marrow transplants for leukemia. Ann Intern Med. 1994;120:646–652. - PubMed
-
- Goulmy E, Schipper R, Pool J, Blokland E, Falkenburg JH, et al. Mismatches of minor histocompatibility antigens between HLA-identical donors and recipients and the development of graft-versus-host disease after bone marrow transplantation. N Engl J Med. 1996;334:281–285. - PubMed
-
- Horowitz MM, Gale RP, Sondel PM, Goldman JM, Kersey J, et al. Graft-versus-leukemia reactions after bone marrow transplantation. Blood. 1990;75:555–562. - PubMed
Publication types
MeSH terms
Substances
Grants and funding
LinkOut - more resources
Full Text Sources
Research Materials

