. 2011;6(8):e23318.
doi: 10.1371/journal.pone.0023318. Epub 2011 Aug 9.

Epigenetic transcriptional regulation of the growth arrest-specific gene 1 (Gas1) in hepatic cell proliferation at mononucleosomal resolution

Affiliations

Epigenetic transcriptional regulation of the growth arrest-specific gene 1 (Gas1) in hepatic cell proliferation at mononucleosomal resolution

Natalia Sacilotto et al. PLoS One. 2011.

Abstract

Background: Gas1 (growth arrest-specific 1) gene is known to inhibit cell proliferation in a variety of models, but its possible implication in regulating quiescence in adult tissues has not been examined to date. The knowledge of how Gas1 is regulated in quiescence may contribute to understand the deregulation occurring in neoplastic diseases.

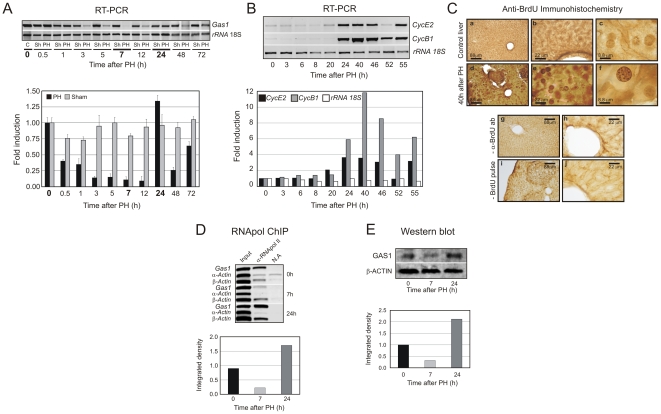
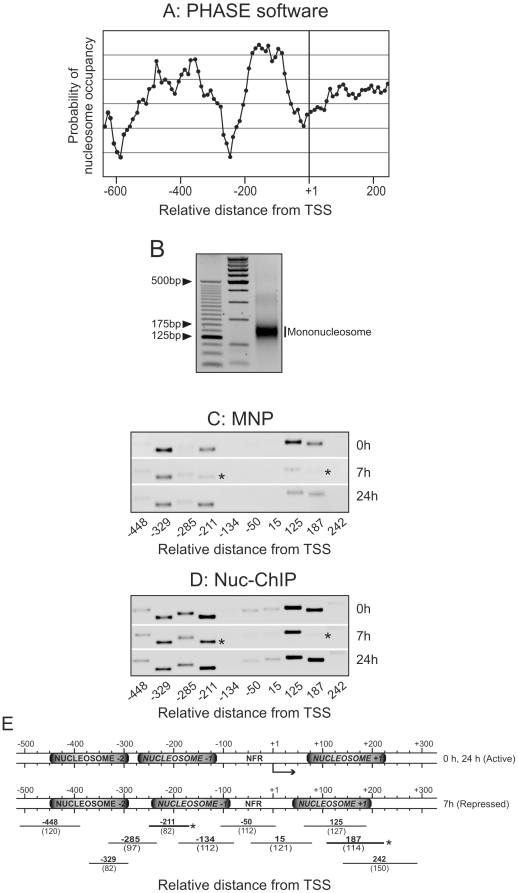
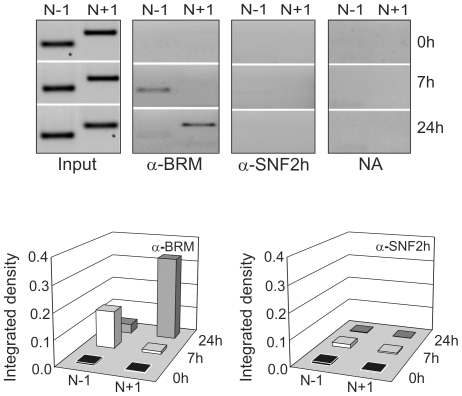
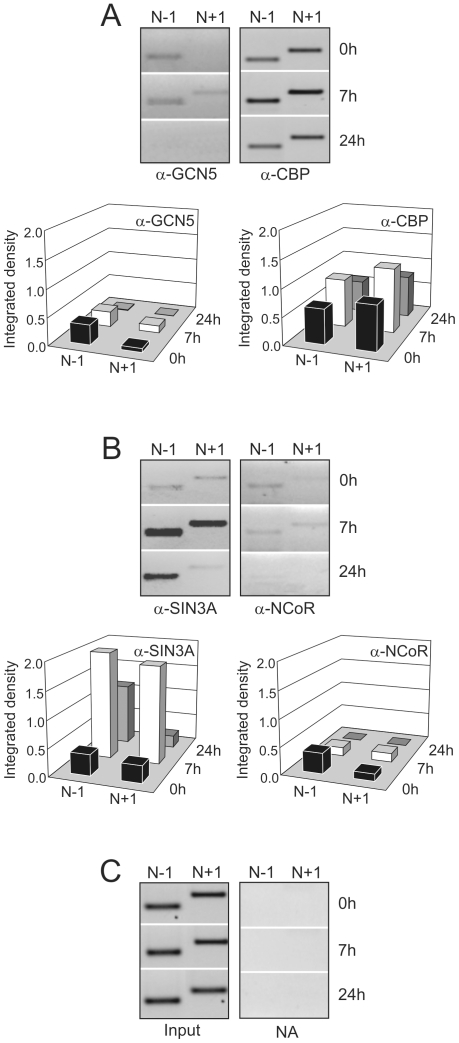
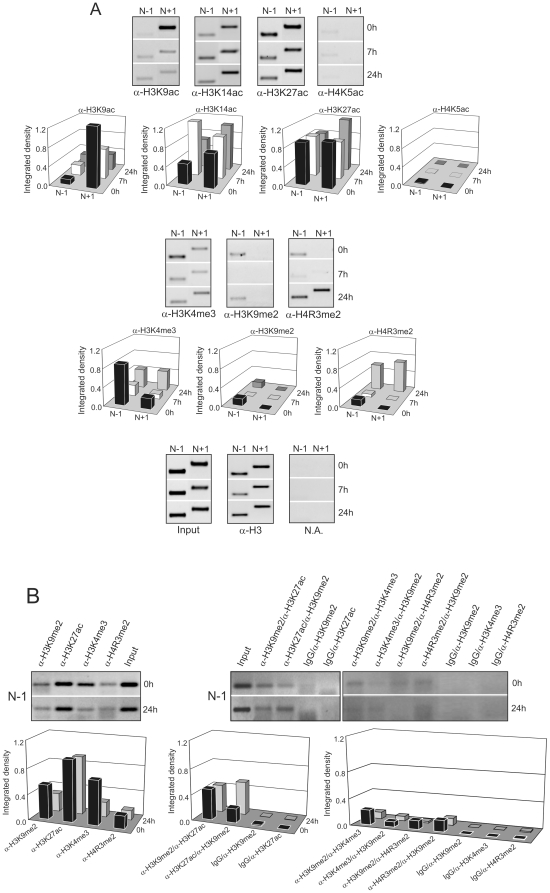
Methodology/principal findings: Gas1 expression has been studied in quiescent murine liver and during the naturally synchronized cell proliferation after partial hepatectomy. Chromatin immunoprecipitation at nucleosomal resolution (Nuc-ChIP) has been used to carry out the study preserving the in vivo conditions. Transcription has been assessed at real time by quantifying the presence of RNA polymerase II in coding regions (RNApol-ChIP). It has been found that Gas1 is expressed not only in quiescent liver but also at the cell cycle G(1)/S transition. The latter expression peak had not been previously reported. Two nucleosomes, flanking a nucleosome-free region, are positioned close to the transcription start site. Both nucleosomes slide in going from the active to the inactive state and vice versa. Nuc-ChIP analysis of the acquisition of histone epigenetic marks show distinctive features in both active states: H3K9ac and H3K4me2 are characteristic of transcription in G(0) and H4R3me2 in G(1)/S transition. Sequential-ChIP analysis revealed that the "repressing" mark H3K9me2 colocalize with several "activating" marks at nucleosome N-1 when Gas1 is actively transcribed suggesting a greater plasticity of epigenetic marks than proposed until now. The recruitment of chromatin-remodeling or modifying complexes also displayed distinct characteristics in quiescence and the G(1)/S transition.

Conclusions/significance: The finding that Gas1 is transcribed at the G(1)/S transition suggests that the gene may exert a novel function during cell proliferation. Transcription of this gene is modulated by specific "activating" and "repressing" epigenetic marks, and by chromatin remodeling and histone modifying complexes recruitment, at specific nucleosomes in Gas1 promoter.


Conflict of interest statement

Competing Interests: The authors have declared that no competing interests exist.

Figures

Figure 1
Figure 1. Expression of growth arrest gene-1 (Gas1) during mouse liver regeneration after partial hepatectomy (PH).
(A) Steady state mRNA levels of Gas1 were measured by semiquantitative (top) and quantitative (bottom) RT-PCR in liver at the indicated times after PH. The values were normalized by the loading control rRNA 18S and expressed as relative to control liver at 0 h after PH. Mice that underwent only laparotomy (Sham operation) were used as control. The bars of errors correspond to the standard deviation of 5–6 independent RT-PCR measurements. (B) Expression of cyclines CycE2 and CycB1. Steady state mRNA levels of cyclines were measured by semiquantitative RT-PCR (top panel) and the bands were integrated by ImageJ software analysis (bottom panel). The values were normalized by the loading control rRNA 18S and expressed as relative to control liver. (C) Immunohistochemical detection of BrdU incorporation at 0 h and 40 h after PH. Immunostaining negative control, with tissue treated in absence of primary α-BrdU antibody, and in absence of BrdU pulse, is also shown. These images are representative of three different experiments. (D, E) Expression of Gas1 at the two selected transcriptional active states (0 and 24 h) and at repressed state (7 h) after PH. The measure was done by RNApol ChIP assay (D) and Western blotting (E). The bands were integrated by ImageJ software and the histograms (bottom panels) were normalized against control liver. The α- and β-Actin genes were used as negative and positive control respectively, and rRNA 18S as an internal control of the RT-PCR analysis.
Figure 2
Figure 2. Nucleosome positioning at Gas1 transcriptional start site (TSS) vicinity.
(A) Theoretical prediction of nucleosome positioning based on PHASE software algorithms. (B) Agarose gel showing mononucleosomal-sized chromatin fragments used for nucleosome positioning. PCR analysis from (C) micrococcal nuclease protection (MNP) and (D) Nuc-ChIP assays for nucleosome positioning. (E) Schematic representation of the positions of nucleosomes empirically determined. The positions of the center (bold letters) and lengths (brackets) of the amplicons used in the PCR reactions are showed at the bottom of the panel. The images are representative of at least three independent experiments.
Figure 3
Figure 3. Nuc-ChIP assay of BRM-containing SWI/SNF and SNH2 h-containing ISWI remodeling complexes after PH.
The PCR bands were integrated by ImageJ software, the background (no antibody samples, NA) subtracted, normalized by dividing by their corresponding Input samples and represented as histograms at the bottom panel. The images are representative of at least three independent experiments.
Figure 4
Figure 4. Nuc-ChIP assay of the chromatin modifying complexes recruitment to Gas1 TSS vicinity after PH.
(A) histone acetyltransferase (GCN5-containing and CBP-containing) and (B) histone deacetylase (Sin3A-containing and NCoR-containing) complexes. (C) Input and non-antibody (NA) samples used to subtract the background and to normalize PCR band signals as described in figure 3.The images are representative of at least three independent experiments.
Figure 5
Figure 5. Nuc-ChIP and sequential-ChIP assays of site-specific epigenetic marks on nucleosomes near to Gas1 TSS vicinity.
(A) Histone acetylation and histone methylation marks at nucleosomes N-1 and N+1 of Gas1 promoter at 0 h, 7 h and 24 h after PH. The PCR bands were integrated by ImageJ software and corrected as in figure 3. The images are representative of at least three independent experiments. (B) Sequential ChIP analysis of “inactivating” (H3K9me2) and “activating” (H3K27ac, H3K4me3 and H4R3me2) epigenetic marks at nucleosome N-1 of Gas1 promoter. Both orders for first and second antibody are assayed. The PCR bands were integrated by ImageJ software and corrected as in figure 3. To subtract the background, the integrated density of a sample where first antibody was replaced by IgG was used. The images are representative of at least three independent experiments.

Similar articles

Cited by

References

    1. Fausto N. Liver regeneration. J Hepatol. 2000;32:19–31. - PubMed
    1. Fausto N, Campbell JS, Riehle KJ. Liver regeneration. Hepatology. 2006;43:S45–53. - PubMed
    1. Fausto N, Laird AD, Webber EM. Liver regeneration. 2. Role of growth factors, cytokines in hepatic regeneration. FASEB J. 1995;9:1527–36. - PubMed
    1. Michalopoulos GK. Liver regeneration. J Cell Physiol. 2007;213:286–300. - PMC - PubMed
    1. Michalopoulos GK. Liver regeneration after partial hepatectomy: critical analysis of mechanistic dilemmas. Am J Pathol. 2010;176:2–13. - PMC - PubMed

Publication types

MeSH terms