. 2011;6(8):e23335.
doi: 10.1371/journal.pone.0023335. Epub 2011 Aug 17.

Fix your eyes in the space you could reach: neurons in the macaque medial parietal cortex prefer gaze positions in peripersonal space

Affiliations

Fix your eyes in the space you could reach: neurons in the macaque medial parietal cortex prefer gaze positions in peripersonal space

Kostas Hadjidimitrakis et al. PLoS One. 2011.

Abstract

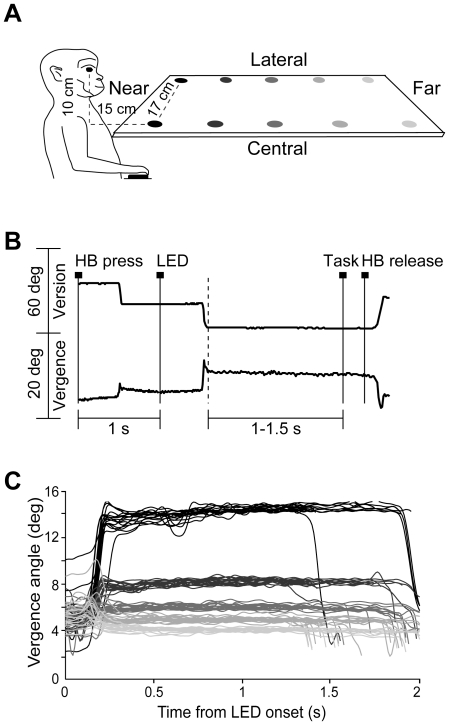
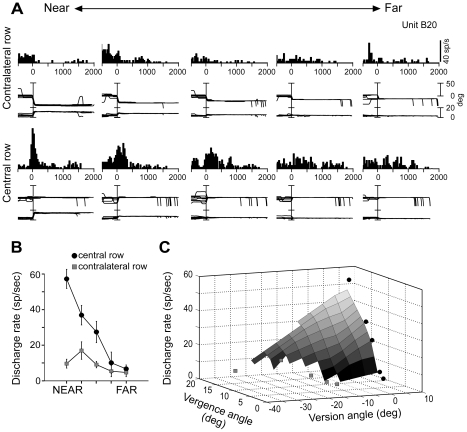
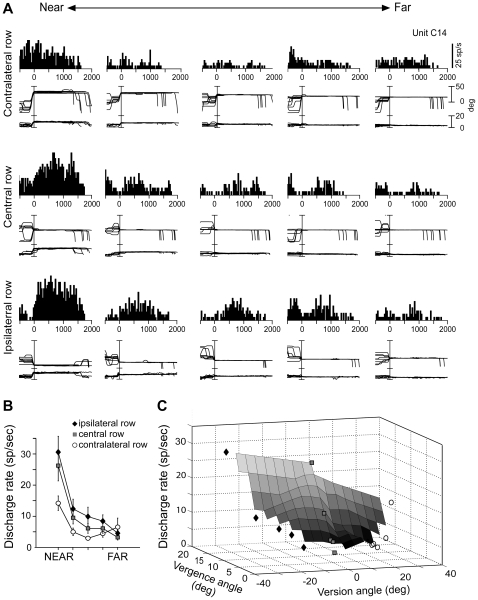
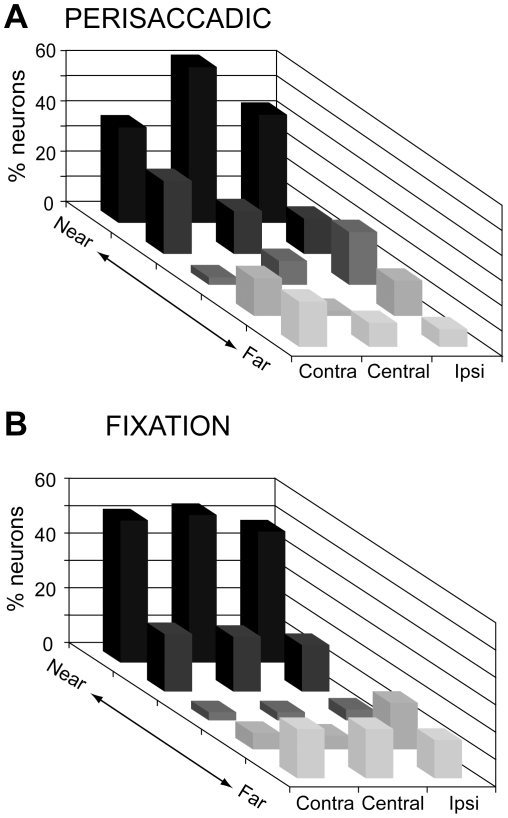
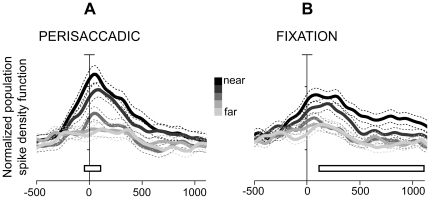
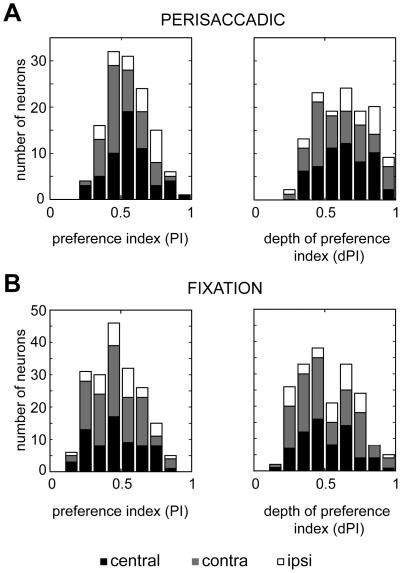
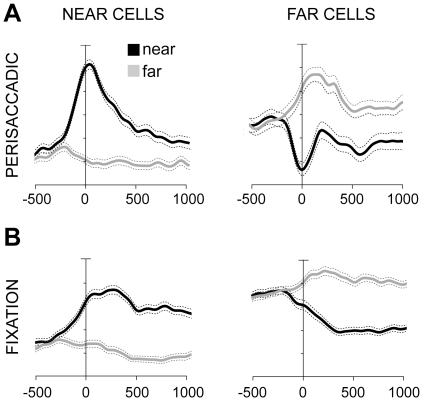
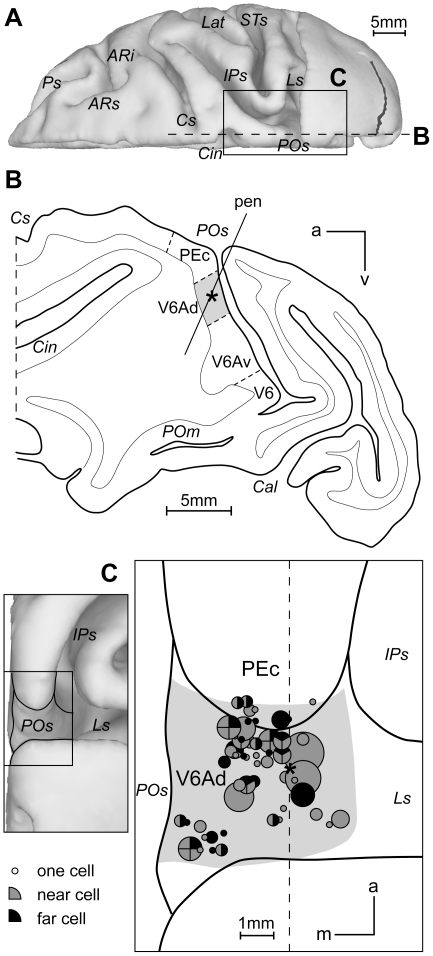
Interacting in the peripersonal space requires coordinated arm and eye movements to visual targets in depth. In primates, the medial posterior parietal cortex (PPC) represents a crucial node in the process of visual-to-motor signal transformations. The medial PPC area V6A is a key region engaged in the control of these processes because it jointly processes visual information, eye position and arm movement related signals. However, to date, there is no evidence in the medial PPC of spatial encoding in three dimensions. Here, using single neuron recordings in behaving macaques, we studied the neural signals related to binocular eye position in a task that required the monkeys to perform saccades and fixate targets at different locations in peripersonal and extrapersonal space. A significant proportion of neurons were modulated by both gaze direction and depth, i.e., by the location of the foveated target in 3D space. The population activity of these neurons displayed a strong preference for peripersonal space in a time interval around the saccade that preceded fixation and during fixation as well. This preference for targets within reaching distance during both target capturing and fixation suggests that binocular eye position signals are implemented functionally in V6A to support its role in reaching and grasping.


Conflict of interest statement

Competing Interests: The authors have declared that no competing interests exist.

Figures

Figure 1
Figure 1. Experimental setup and task sequence.
(A): Scheme of the set up used for the fixation in depth task. Eye movements were performed in darkness towards one of the ten LEDs of a horizontal panel. (B): Time course of the task. A typical example of the version (top) and vergence (bottom) traces during a single trial is shown. Long vertical continuous lines indicate the occurrence of events during the task. From left to right markers show: trial's start (HB press), target appearance (LED light on green), end of fixation (Task, green to red change of the LED) and trial end (HB release). Long vertical dashed line indicates the end of the saccade. (C): Calibrated vergence eye position signal (in degrees) during fixation of the LEDs of the central row (different tones of grey), in an example recording. Vergence angle is maintained for the whole required fixation (1 s–1.5 s) and is clearly distinguishable among the different targets.
Figure 2
Figure 2. Example of a neuron with perisaccadic activity modulated by depth.
(A): Spike histograms of neural responses, eye traces (version upper trace, vergence lower trace) to the five LEDs of the contralateral/central row arranged from near (left) to far (right), aligned at the start of the saccade. This cell shows a clear preference for saccades at the central and near space. (B): Mean± standard error (s.e.m.) discharge rates of the cell in (A) are shown for each LED of the contralateral (white rectangles) and central (black circles) row. (C): Three dimensonal plot obtained by interpolating mean discharge rates for the average value of vergence and version of each LED of the contralateral (white rectangles) and central (black circles) row. Vergence modulates this cell only along the midsagittal row.
Figure 3
Figure 3. Example of a neuron with fixation activity modulated by depth.
(A): Top/Middle/Bottom: neural responses and eye traces to the five LEDs of the contralateral/central/ipsilateral space arranged from near (left) to far (right), aligned at the end of the saccade. This cell prefers targets located at near and ipsilateral space. (B): Mean± s.e.m. discharge rates are shown for each LED of the contralateral (white circles), central (grey squares) and ipsilateral (black diamonds) row. (C): Three dimensional plot obtained by interpolating mean discharge rates for the average value of vergence and version of each LED of the contralateral (white circles), central (grey squares) and ipsilateral (black diamonds) row. Cell discharge reflects a strong tuning by vergence that is influenced by version, so that the cell is activated maximally for fixations on the nearest targets, especially in the ipsilateral space.
Figure 4
Figure 4. Preferred target positions in depth.
Frequency histogram of the positions that neurons preferred in (A) perisaccadic (N = 91) and (B) fixation (N = 167) epochs. Ipsi and Contra indicate fixation position with respect to the recording hemisphere. Center refers to the straight ahead of the monkey. In both epochs there is a clear preference for near, reachable targets across all space.
Figure 5
Figure 5. Preference for near space at the population level.
Population activity per each LED position (different tones of grey) of V6A cells modulated in (A) perisaccadic (N = 132) and (B) fixation (N = 193) averaging across all rows. Activity is expressed as averaged normalized SDF (thick lines) with variability bands (s.e.m., dashed lines) and is aligned at saccade onset in both (A) and (B). Each modulated cell was taken into account five times, once for every LED position. The peak of the SDF curve of the LED with maximum activity was set to 1 (or 100%) and was used to normalize the activity curves of the other targets. Accordingly, the population activity of each target is expressed as percentage of the averaged normalized activity. White rectangular boxes indicate the time intervals used at the permutation test (two nearest targets always different form the farthest ones, P<0.05, see text); vertical axis: 10% of normalized activity per division and axis origin corresponds to 20% of normalized activity.
Figure 6
Figure 6. Selectivity and strength of modulation for depth in V6A.
Frequency distributions of preference index (PI), and depth of preference index (dPI) of the cells modulated in perisaccadic (A) and fixation (B) epochs in central, contralateral and ipsilateral space.
Figure 7
Figure 7. Population activity of “Near” and “Far” cells.
(A). Average activity represented as averaged normalized SDF (ordinate) for near (black) and far targets (grey) in V6A cells with preference in perisaccadic epoch for the two nearest targets, “Near”cells (N = 132) and for the three farthest targets, “Far” cells (N = 51). (B). Average activity of Near cells (N = 230) and Far cells (N = 89) in fixation epoch. In both A and B activity is aligned at saccade onset. Other details as in Figure 5.
Figure 8
Figure 8. Recording sites and preference for near and far space.
(A) The location of area V6A in the parieto-occipital sulcus (POs) is shown in a dorsal view of a hemisphere reconstructed in 3D using Caret software (http://brainmap.wustl.edu/caret/). (B) Representative parasagittal section at the level of the dashed line of panels A and C showing the dorsoventral extent of recorded region. Grey area: extent of V6Ad in that section. Asterisk: recording site of two near cells. (C) Enlarged view of the recorded region. Each circle represents the projection on the dorsal surface of a single penetration. Circle diameter is proportional to the incidence of preference for near (black) and far (gray) space. Asterisk: as in B. Dashed line: level of the section shown in B. Ps, principal sulcus; ARi, arcuate sulcus inferior ramus; ARs, arcuate sulcus superior ramus; Cs, central sulcus; Cin, cinguate sulcus; Lat, lateral sulcus; STs, superior temporal sulcus; IPs, intraparietal sulcus; Ls, lunate sulcus; POm, medial parieto-occipital sulcus; Cal, calcarine sulcus; m:medial; a:anterior; d:dorsal.

Similar articles

Cited by

References

    1. Critchley M. Tactile thought, with special reference to the blind. Brain. 1953;76:19–35. - PubMed
    1. Karnath HO. Spatial orientation and the representation of space with parietal lobe lesions. Philos Trans R Soc Lond B Biol Sci. 1997;352:1411–1419. - PMC - PubMed
    1. Perenin MT, Vighetto A. Optic ataxia: a specific disruption in visuomotor mechanisms. I. Different aspects of the deficit in reaching for objects. Brain. 1988;111(Pt 3):643–674. - PubMed
    1. Baylis GC, Baylis LL. Visually misguided reaching in Balint's syndrome. Neuropsychologia. 2001;39:865–875. - PubMed
    1. Danckert J, Goldberg L, Broderick C. Damage to superior parietal cortex impairs pointing in the sagittal plane. Exp Brain Res. 2009;195:183–191. - PubMed

Publication types

MeSH terms