

Degenerate wave and capacitive coupling increase human MSC invasion and proliferation while reducing cytotoxicity in an in vitro wound healing model
- PMID: 21858102
- PMCID: PMC3156742
- DOI: 10.1371/journal.pone.0023404
Degenerate wave and capacitive coupling increase human MSC invasion and proliferation while reducing cytotoxicity in an in vitro wound healing model
Abstract
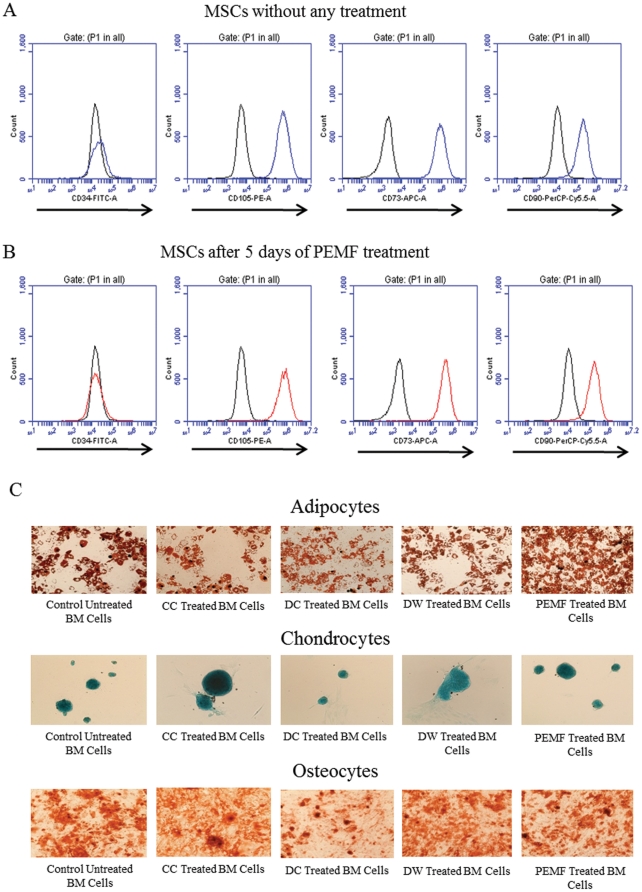
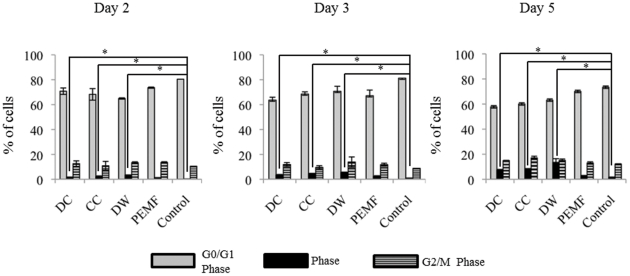
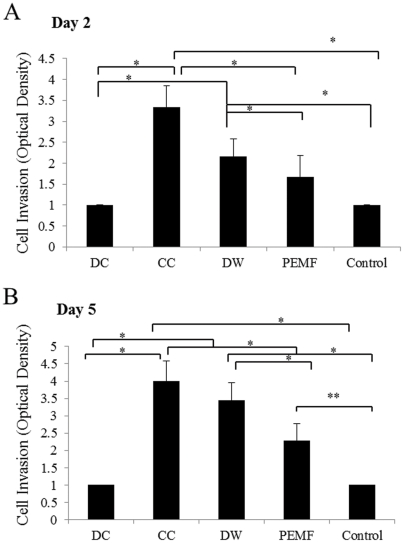
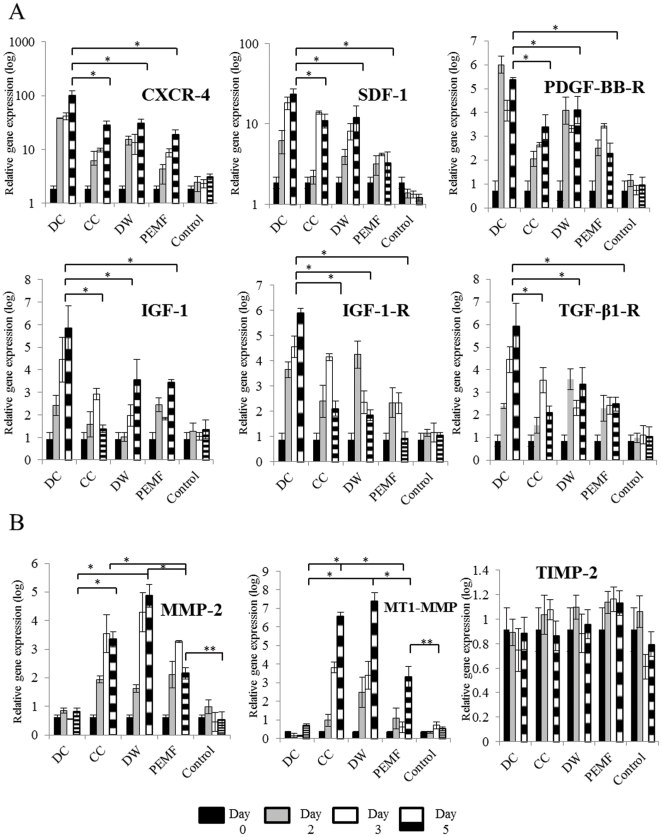
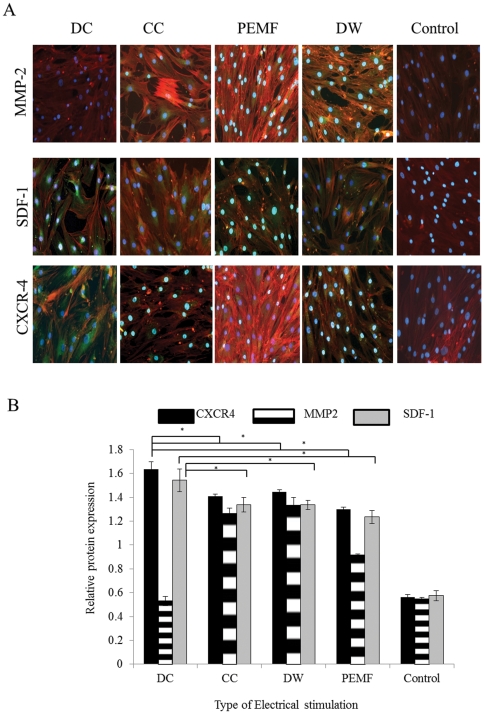
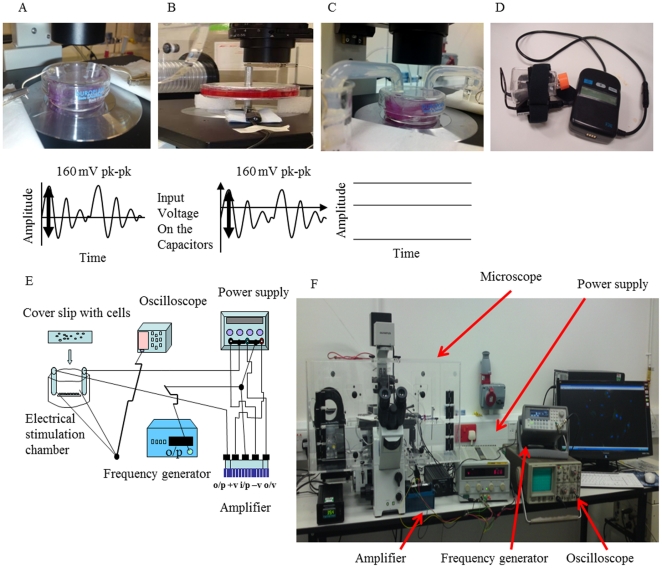
Non-unions pose complications in fracture management that can be treated using electrical stimulation (ES). Bone marrow mesenchymal stem cells (BMMSCs) are essential in fracture healing; however, the effect of different clinical ES waveforms on BMMSCs cellular activities remains unknown. We compared the effects of direct current (DC), capacitive coupling (CC), pulsed electromagnetic field (PEMF) and degenerate wave (DW) on cellular activities including cytotoxicity, proliferation, cell-kinetics and apoptosis by stimulating human-BMMSCs 3 hours a day, up to 5 days. In addition, migration and invasion were assessed using fluorescence microscopy and by quantifying gene and protein expression. We found that DW had the greatest proliferative and least apoptotic and cytotoxic effects compared to other waveforms. DC, DW and CC stimulations resulted in a higher number of cells in S phase and G(2)/M phase as shown by cell cycle analysis. CC and DW caused more cells to invade collagen and showed increased MMP-2 and MT1-MMP expression. DC increased cellular migration in a scratch-wound assay and all ES waveforms enhanced expression of migratory genes with DC having the greatest effect. All ES treated cells showed similar progenitor potential as determined by MSC differentiation assay. All above findings were shown to be statistically significant (p<0.05). We conclude that ES can influence BMMSCs activities, especially DW and CC, which show greater invasion and higher cell proliferation compared to other types of ES. Application of DW or CC to the fracture site may help in the recruitment of BMMSCs to the wound that may enhance rate of bone healing at the fracture site.
Conflict of interest statement
Figures


Similar articles
-
Enhancement of differentiation and mineralisation of osteoblast-like cells by degenerate electrical waveform in an in vitro electrical stimulation model compared to capacitive coupling.PLoS One. 2013 Sep 11;8(9):e72978. doi: 10.1371/journal.pone.0072978. eCollection 2013. PLoS One. 2013. PMID: 24039834 Free PMC article.
-
Migration of culture-expanded human mesenchymal stem cells through bone marrow endothelium is regulated by matrix metalloproteinase-2 and tissue inhibitor of metalloproteinase-3.Haematologica. 2007 Apr;92(4):440-9. doi: 10.3324/haematol.10475. Haematologica. 2007. PMID: 17488654
-
The culture of temporary tumor-like bone marrow mesenchymal stem cells (TT-BMSC) and the detection of cell biology property.Ann Transplant. 2011 Jul-Sep;16(3):49-58. doi: 10.12659/aot.881995. Ann Transplant. 2011. PMID: 21959510
-
The paradoxical dynamism of marrow stem cells: considerations of stem cells, niches, and microvesicles.Stem Cell Rev. 2008 Sep;4(3):137-47. doi: 10.1007/s12015-008-9036-y. Epub 2008 Jul 30. Stem Cell Rev. 2008. PMID: 18665337 Free PMC article. Review.
-
Electrical Stimulation Technologies for Wound Healing.Adv Wound Care (New Rochelle). 2014 Feb 1;3(2):81-90. doi: 10.1089/wound.2013.0459. Adv Wound Care (New Rochelle). 2014. PMID: 24761348 Free PMC article. Review.
Cited by
-
New cosurface capacitive stimulators for the development of active osseointegrative implantable devices.Sci Rep. 2016 Jul 26;6:30231. doi: 10.1038/srep30231. Sci Rep. 2016. PMID: 27456818 Free PMC article.
-
Electrical Stimulation of Oral Tissue-Derived Stem Cells: Unlocking New Potential for Dental and Periodontal Regeneration.Cells. 2025 Jun 4;14(11):840. doi: 10.3390/cells14110840. Cells. 2025. PMID: 40498016 Free PMC article. Review.
-
Effect of mesenchymal stem cells versus aloe vera on healing of deep second-degree burn.Stem Cell Investig. 2021 Jun 15;8:12. doi: 10.21037/sci-2020-030. eCollection 2021. Stem Cell Investig. 2021. PMID: 34268441 Free PMC article.
-
Changes in the extracellular microenvironment and osteogenic responses of mesenchymal stem/stromal cells induced by in vitro direct electrical stimulation.J Tissue Eng. 2021 Feb 16;12:2041731420974147. doi: 10.1177/2041731420974147. eCollection 2021 Jan-Dec. J Tissue Eng. 2021. PMID: 33643602 Free PMC article.
-
Evaluation of Pulsed Electromagnetic Field Effects: A Systematic Review and Meta-Analysis on Highlights of Two Decades of Research In Vitro Studies.Biomed Res Int. 2021 Jul 29;2021:6647497. doi: 10.1155/2021/6647497. eCollection 2021. Biomed Res Int. 2021. PMID: 34368353 Free PMC article.
References
-
- Brashear HR. Treatment of Ununited Fractures of the Long Bones; Diagnosis and Prevention of Non-Union. J Bone Joint Surg Am. 1965;47:174–178. - PubMed
-
- Cypher TJ, Grossman JP. Biological principles of bone graft healing. J Foot Ankle Surg. 1996;35:413–417. - PubMed
-
- Finkemeier CG. Bone-grafting and bone-graft substitutes. J Bone Joint Surg Am. 2002;84-A:454–464. - PubMed
-
- Barry FP, Murphy JM. Mesenchymal stem cells: clinical applications and biological characterization. Int J Biochem Cell Biol. 2004;36:568–584. - PubMed
-
- Schindeler A, McDonald MM, Bokko P, Little DG. Bone remodeling during fracture repair: The cellular picture. Semin Cell Dev Biol. 2008;19:459–466. - PubMed
Publication types
MeSH terms
Substances
LinkOut - more resources
Full Text Sources
Miscellaneous
