. 2011;6(8):e23522.
doi: 10.1371/journal.pone.0023522. Epub 2011 Aug 15.

Activation of aryl hydrocarbon receptor (AhR) leads to reciprocal epigenetic regulation of FoxP3 and IL-17 expression and amelioration of experimental colitis

Affiliations

Activation of aryl hydrocarbon receptor (AhR) leads to reciprocal epigenetic regulation of FoxP3 and IL-17 expression and amelioration of experimental colitis

Narendra P Singh et al. PLoS One. 2011.

Abstract

Background: Aryl hydrocarbon receptor (AhR), a transcription factor of the bHLH/PAS family, is well characterized to regulate the biochemical and toxic effects of environmental chemicals. More recently, AhR activation has been shown to regulate the differentiation of Foxp3(+) Tregs as well as Th17 cells. However, the precise mechanisms are unclear. In the current study, we investigated the effect of 2,3,7,8-tetrachlorodibenzo-p-dioxin (TCDD), a potent AhR ligand, on epigenetic regulation leading to altered Treg/Th17 differentiation, and consequent suppression of colitis.

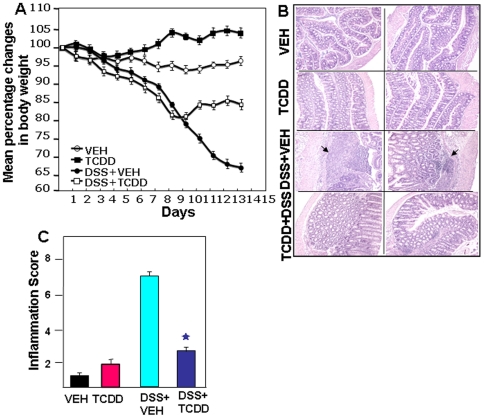
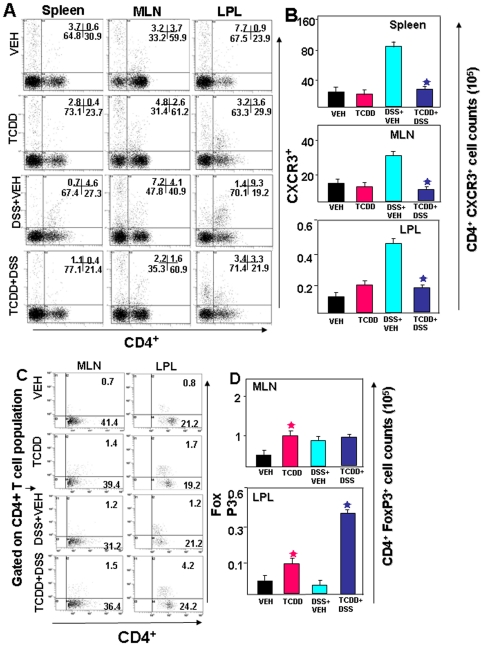
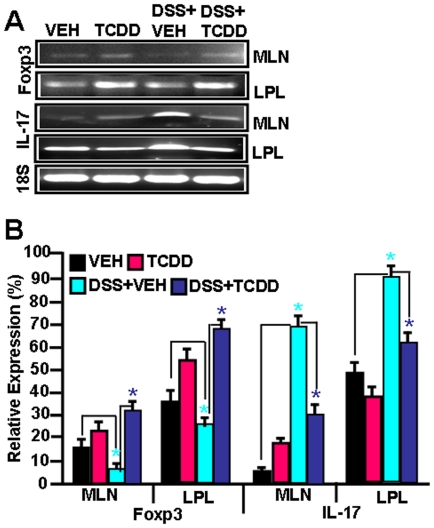
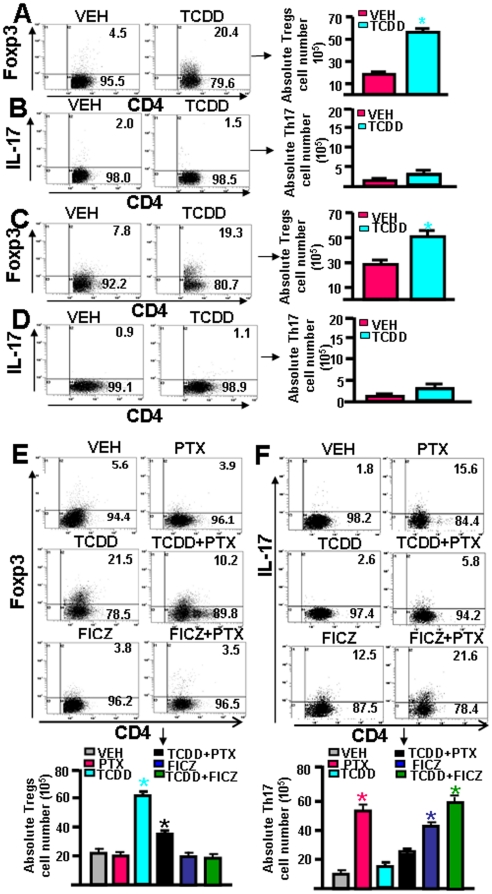
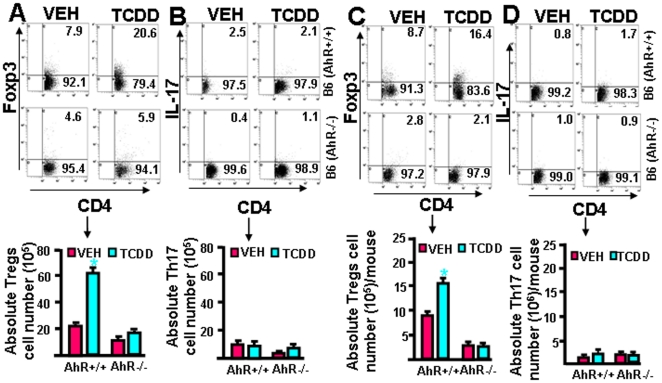
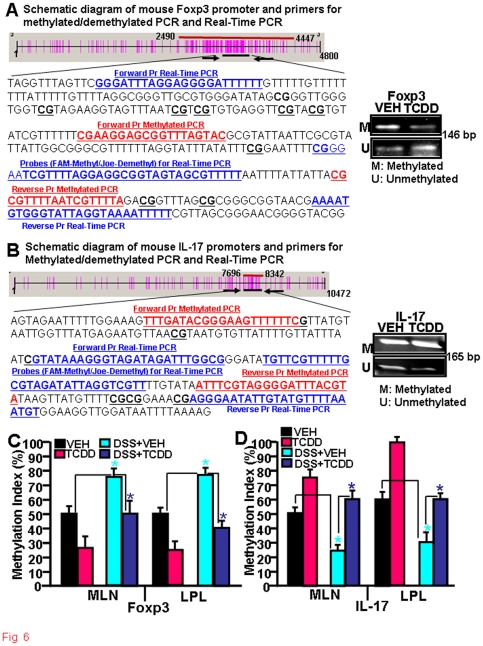
Methodology/principal findings: Dextran sodium sulphate (DSS) administration induced acute colitis in C57BL/6 mice, as shown by significant weight loss, shortening of colon, mucosal ulceration, and increased presence of CXCR3(+) T cells as well as inflammatory cytokines. Interestingly, a single dose of TCDD (25 µg/kg body weight) was able to attenuate all of the clinical and inflammatory markers of colitis. Analysis of T cells in the lamina propria (LP) and mesenteric lymph nodes (MLN), during colitis, revealed decreased presence of Tregs and increased induction of Th17 cells, which was reversed following TCDD treatment. Activation of T cells from AhR(+/+) but not AhR (-/-) mice, in the presence of TCDD, promoted increased differentiation of Tregs while inhibiting Th17 cells. Analysis of MLN or LP cells during colitis revealed increased methylation of CpG islands of Foxp3 and demethylation of IL-17 promoters, which was reversed following TCDD treatment.

Conclusions/significance: These studies demonstrate for the first time that AhR activation promotes epigenetic regulation thereby influencing reciprocal differentiation of Tregs and Th17 cells, and amelioration of inflammation.


Conflict of interest statement

Competing Interests: The authors have declared that no competing interests exist.

Figures

Figure 1
Figure 1. Change in body weight, histological characterization, and severity of colitis in mice after DSS induction and TCDD treatment.
A. We used 4 groups of C57BL/6 mice: those that received VEH alone, TCDD (25 µg/kg body weight) alone, DSS+VEH, or a combination of DSS+TCDD. In DSS mice, TCDD was given as a single dose on the first day of DSS exposure. After seven days, DSS was replaced with a water cycle (ad libitum) for another seven days. The body weight of the mice was recorded daily. The statistical significance difference between each groups were assessed by using Mann-Whitney U Test. Data represents the mean of three experiment involving 6 mice per group. There was statistically significant difference between DSS+VEH vs DSS+TCDD groups (p<0.05). B. Histological sections of colons from the 4 groups of mice, DSS+VEH-treated mice showed significant lymphocyte infiltration and distortion of glands, while DSS+TCDD-treated mice showed colon lumen having markedly decreased lymphocyte infiltration. Other pathologic changes during DSS-induced colitis included diffuse leukocyte infiltrates, distorted crypts, and thickening of the lamina propria in the area of distorted crypts in the colon (B). These changes were significantly reversed in DSS+TCDD groups as seen in inflammation score (C). Asterisks indicate statistically significant differences; i.e., p<0.01 between DSS+VEH versus DSS+TCDD treated group.
Figure 2
Figure 2. Effect of TCDD on CD4+ CXCR3+ in cells from spleen, MLN and LP and generation of Tregs in the LP following development of DSS-induced colitis.
A–B. Splenic MLN and LP cells were isolated from the four groups of mice as described in Fig 1, stained for CD4+ CXCR3+ T cells, and analyzed using flow cytometry. A representative experiment is shown in panel (A), indicating the percentage of CD4+ CXCR3+ T cells, and absolute numbers (mean ± SEM) of these cells from groups of 6 mice are depicted in panel B. Asterisks (*) indicate statistically significant differences with p<0.01 between DSS+VEH versus DSS+TCDD treated group. C–D. MLN and LP cells were isolated from the 4 groups of mice and stained for CD4+ Foxp3+ cells. A representative experiment is shown in panel C, and absolute numbers (mean ± SEM) of these cells from groups of 6 mice are depicted in panel D. Asterisks (*) indicate statistically significant differences (with p<0.01) between VEH versus TCDD alone and DSS+VEH versus DSS+TCDD treated group.
Figure 3
Figure 3. Effect of TCDD administration in vivo on Foxp3 and IL-17 expression in lymphoid organs during colitis.
MLN, and LP cells were isolated on day 14 of colitis from the 4 groups of mice as described in Fig. 1. RT-PCR was used to detect mRNA levels for Foxp3 and IL-17 (panel A) and data from 3 independent experiments in each group is shown in panel B. Vertical bars represent mean+/− SEM of three independent experiments. Comparisons were made between VEH vs DSS+VEH groups as well as between DSS+VEH vs DSS+TCDD groups. Asterisks (*) represent statistically significant (p<0.05) difference between VEH and DSS+VEH groups and between DSS+VEH and DSS+TCDD groups.
Figure 4
Figure 4. Effect of AhR activation by different ligands on reciprocal differentiation of Tregs and Th17 cells in vitro.
T cells from naïve C57BL/6 mice were activated using anti-mouse CD3 (1 µg/ml) and CD28 (1 µg/ml) mAbs (A, B) or T cells from OTII.2a mice were activated with BMDCs pulsed with Ova peptide (C, D). The cultures received VEH or TCDD (100 nM/ml) for 72 hrs. In panels E and F, T cells from naïve C57BL/6 mice were cultured with BMDCs along with low doses of anti-CD3 Abs (0.5 µg/ml)) and pertusis toxin (PTX), to promote Th17 cells. These cultures also received VEH, TCDD (100 nM/ml) or FICZ (100 nM/ml) for 72 hrs. The cells were gated for CD4 and analyzed for Foxp3 or IL-17. Data from a representative histogram and from three independent experiments have been shown. Vertical bars represent mean ± SEM. In panels A–D, data were compared between TCDD vs VEH and in panels E and F, PTX groups were compared with PTX+TCDD. Asterisks (*) represent statistically significant (p<0.05) difference.
Figure 5
Figure 5. TCDD requires AhR to induce reciprocal differentiation of Tregs and Th17 cells in vitro and in vivo.
In panels A and B, T cells from C57BL/6 wild-type (AhR+/+) and knockout (AhR-/-) mice were cultured in the presence of anti-mouse CD3 (2 µg/ml) and CD28 (1 µg/ml) mAbs for 72 hrs. These cells were simultaneously treated with VEH or TCDD (100 nM/ml). The cells were stained for Tregs (CD4+ FoxP-3+) and Th17 (CD4+ IL-17+) cells. In panels C and D, C57BL/6 wild type (AhR+/+) and knockout (AhR-/-) mice were injected with VEH or TCDD and 5 days later, spleen cells were analyzed for Tregs (CD4+ FoxP-3+) and Th17 (CD4+ IL-17+) cells. Both percentages and absolute numbers of Tregs and Th17 cells were depicted. Vertical bars represent data (mean ± SEM) from three independent experiments. Statistical comparisons were made between TCDD and VEH-treated groups and asterisks (*) represent statistically significant (p<0.05) differences.
Figure 6
Figure 6. Effect of TCDD on methylation of Foxp3 and IL-17 promoters during colitis.
A-B: Phyisical map generated using Methylprimer Express software (v 1.0) is demonstrating the distribution of CpG islands (vertical red bars) and the position of the MSP primer pairs on the mouse Foxp3 (A) and Il-17 (B) promoter. PCR amplicons of promoter region of Foxp3 gene amplified by methylated or demethylated sets of primers in T cells activated in vitro with anti-CD3+anti-CD28 Abs, treated in the presence of VEH or TCDD, has also been depicted in the right panels. C-D: Real Time PCR demonstrating methylation/demethylation status of Foxp3 and IL-17 promoters in MLN and LPL in vivo. MLNs and LP lymphocytes were isolated from the four groups of mice as described in Fig 1. Data (mean ±SEM) from 3 independent experiments are shown. Comparisons were made between VEH vs DSS+VEH groups as well as between DSS+VEH vs DSS+TCDD groups. Asterisks (*) represent statistically significant (p<0.05) difference between VEH vs DSS+VEH treated groups, and between DSS+VEH vs DSS+TCDD treated groups.

References

    1. Tian Y. Ah receptor and NF-kappaB interplay on the stage of epigenome. Biochem Pharmacol. 2009;77:670–680. - PubMed
    1. Hahn ME. Aryl hydrocarbon receptors: diversity and evolution. Chem Biol Interact. 2002;141:131–160. - PubMed
    1. Hu W, Sorrentino C, Denison MS, Kolaja K, Fielden MR. Induction of cyp1a1 is a nonspecific biomarker of aryl hydrocarbon receptor activation: results of large scale screening of pharmaceuticals and toxicants in vivo and in vitro. Molecular Pharmacology. 2007;71:1475–1486. - PubMed
    1. Bock KW, Kohle C. Ah receptor: dioxin-mediated toxic responses as hints to deregulated physiologic functions. Biochem Pharmacol. 2006;72:393–404. - PubMed
    1. Esser C, Rannug A, Stockinger B. The aryl hydrocarbon receptor in immunity. Trends in Immunology. 2009;30:447–454. - PubMed

Publication types

MeSH terms