Systematic spatial bias in DNA microarray hybridization is caused by probe spot position-dependent variability in lateral diffusion
- PMID: 21858215
- PMCID: PMC3157431
- DOI: 10.1371/journal.pone.0023727
Systematic spatial bias in DNA microarray hybridization is caused by probe spot position-dependent variability in lateral diffusion
Abstract
Background: The hybridization of nucleic acid targets with surface-immobilized probes is a widely used assay for the parallel detection of multiple targets in medical and biological research. Despite its widespread application, DNA microarray technology still suffers from several biases and lack of reproducibility, stemming in part from an incomplete understanding of the processes governing surface hybridization. In particular, non-random spatial variations within individual microarray hybridizations are often observed, but the mechanisms underpinning this positional bias remain incompletely explained.
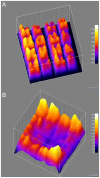
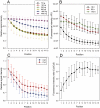
Methodology/principal findings: This study identifies and rationalizes a systematic spatial bias in the intensity of surface hybridization, characterized by markedly increased signal intensity of spots located at the boundaries of the spotted areas of the microarray slide. Combining observations from a simplified single-probe block array format with predictions from a mathematical model, the mechanism responsible for this bias is found to be a position-dependent variation in lateral diffusion of target molecules. Numerical simulations reveal a strong influence of microarray well geometry on the spatial bias.
Conclusions: Reciprocal adjustment of the size of the microarray hybridization chamber to the area of surface-bound probes is a simple and effective measure to minimize or eliminate the diffusion-based bias, resulting in increased uniformity and accuracy of quantitative DNA microarray hybridization.
Conflict of interest statement
Figures


Similar articles
-
Continuously tunable nucleic acid hybridization probes.Nat Methods. 2015 Dec;12(12):1191-6. doi: 10.1038/nmeth.3626. Epub 2015 Oct 19. Nat Methods. 2015. PMID: 26480474 Free PMC article.
-
Diffusion, mixing, and associated dye effects in DNA-microarray hybridizations.Biophys J. 2005 Nov;89(5):3277-84. doi: 10.1529/biophysj.105.067934. Epub 2005 Aug 12. Biophys J. 2005. PMID: 16100268 Free PMC article.
-
Real-time fluorescent image analysis of DNA spot hybridization kinetics to assess microarray spot heterogeneity.Anal Chem. 2012 Nov 6;84(21):9379-87. doi: 10.1021/ac302165h. Epub 2012 Oct 29. Anal Chem. 2012. PMID: 23043216 Free PMC article.
-
Physico-chemical foundations underpinning microarray and next-generation sequencing experiments.Nucleic Acids Res. 2013 Mar 1;41(5):2779-96. doi: 10.1093/nar/gks1358. Epub 2013 Jan 9. Nucleic Acids Res. 2013. PMID: 23307556 Free PMC article. Review.
-
Microfluidic DNA microarray analysis: a review.Anal Chim Acta. 2011 Feb 14;687(1):12-27. doi: 10.1016/j.aca.2010.11.056. Epub 2010 Dec 17. Anal Chim Acta. 2011. PMID: 21241842 Review.
Cited by
-
Distribution, functional impact, and origin mechanisms of copy number variation in the barley genome.Genome Biol. 2013 Jun 12;14(6):R58. doi: 10.1186/gb-2013-14-6-r58. Genome Biol. 2013. PMID: 23758725 Free PMC article.
-
Expression of the ZIP/SLC39A transporters in β-cells: a systematic review and integration of multiple datasets.BMC Genomics. 2017 Sep 11;18(1):719. doi: 10.1186/s12864-017-4119-2. BMC Genomics. 2017. PMID: 28893192 Free PMC article.
-
Adenoviral detection by recombinase polymerase amplification and vertical flow paper microarray.Anal Bioanal Chem. 2019 Feb;411(4):813-822. doi: 10.1007/s00216-018-1503-y. Epub 2018 Nov 29. Anal Bioanal Chem. 2019. PMID: 30498984 Free PMC article.
-
"RADIOTRANSCRIPTOMICS": A synergy of imaging and transcriptomics in clinical assessment.Quant Biol. 2016 Mar;4(1):1-12. doi: 10.1007/s40484-016-0061-6. Epub 2016 Mar 4. Quant Biol. 2016. PMID: 28529815 Free PMC article.
-
Probe-target hybridization depends on spatial uniformity of initial concentration condition across large-format chips.Sci Rep. 2020 May 29;10(1):8768. doi: 10.1038/s41598-020-65563-3. Sci Rep. 2020. PMID: 32472029 Free PMC article.
References
-
- Schena M, Shalon D, Davis RW, Brown PO. Quantitative monitoring of gene expression patterns with a complementary DNA microarray. Science. 1995;270:467–470. - PubMed
-
- Lazazzera BA. Lessons from DNA microarray analysis: the gene expression profile of biofilms. Curr Opin Microbiol. 2005;8:222–227. - PubMed
-
- Yoo SM, Choi JH, Lee SY, Yoo NC. Applications of DNA microarray in disease diagnostics. J Microbiol Biotechnol. 2009;19:635–646. - PubMed
Publication types
MeSH terms
Substances
Grants and funding
LinkOut - more resources
Full Text Sources
Molecular Biology Databases

