

PTTG1 attenuates drug-induced cellular senescence
- PMID: 21858218
- PMCID: PMC3157437
- DOI: 10.1371/journal.pone.0023754
PTTG1 attenuates drug-induced cellular senescence
Abstract
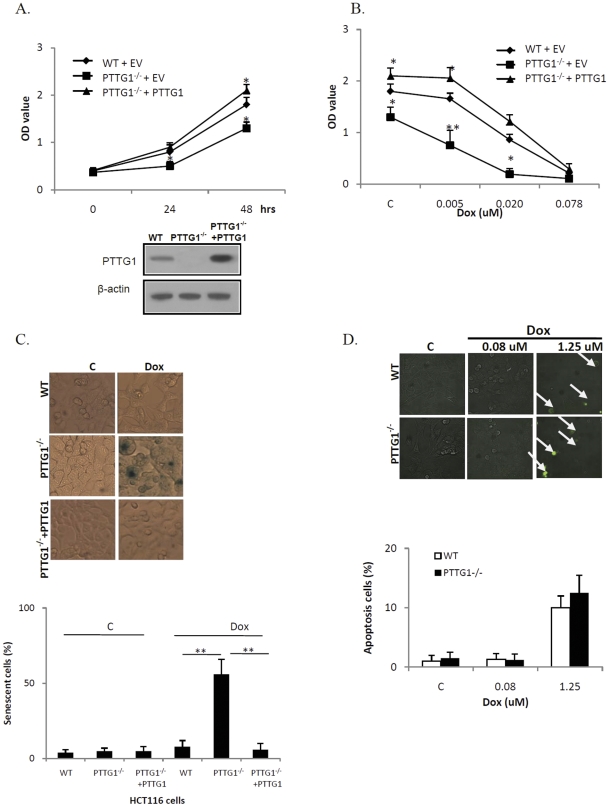
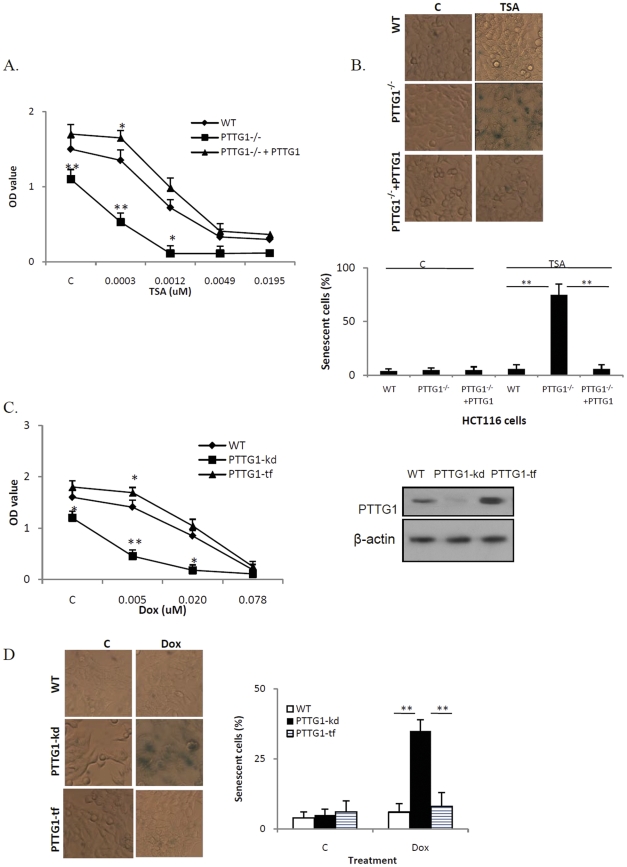
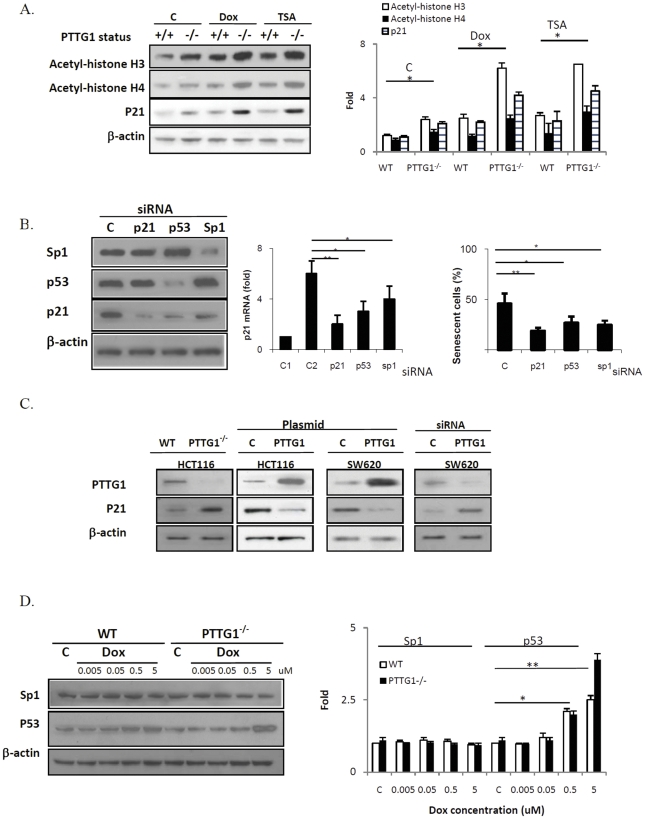
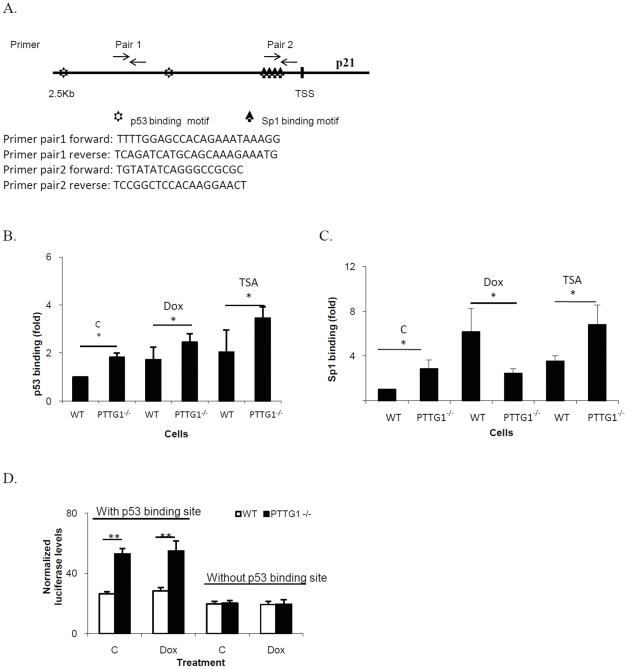
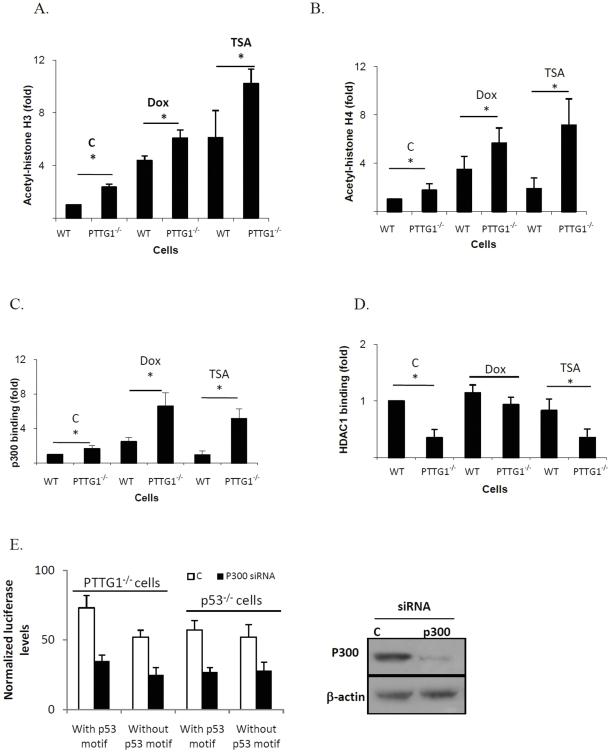
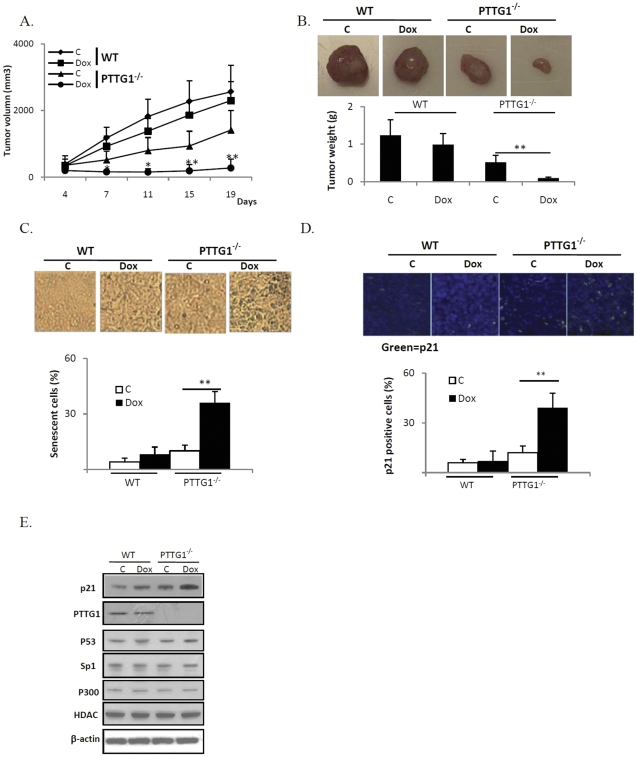
As PTTG1 (pituitary tumor transforming gene) abundance correlates with adverse outcomes in cancer treatment, we determined mechanisms underlying this observation by assessing the role of PTTG1 in regulating cell response to anti-neoplastic drugs. HCT116 cells devoid of PTTG1 (PTTG1(-/-)) exhibited enhanced drug sensitivity as assessed by measuring BrdU incorporation in vitro. Apoptosis, mitosis catastrophe or DNA damage were not detected, but features of senescence were observed using low doses of doxorubicin and TSA. The number of drug-induced PTTG1(-/-) senescent cells increased ∼4 fold as compared to WT PTTG1-replete cells (p<0.001). p21, an important regulator of cell senescence, was induced ∼3 fold in HCT116 PTTG1(-/-) cells upon doxorubicin or Trichostatin A treatment. Binding of Sp1, p53 and p300 to the p21 promoter was enhanced in PTTG1(-/-) cells after treatment, suggesting transcriptional regulation of p21. p21 knock down abrogated the observed senescent effects of these drugs, indicating that PTTG1 likely suppresses p21 to regulate drug-induced senescence. PTTG1 also regulated SW620 colon cancer cells response to doxorubicin and TSA mediated by p21. Subcutaneously xenografted PTTG1(-/-) HCT116 cells developed smaller tumors and exhibited enhanced responses to doxorubicin. PTTG1(-/-) tumor tissue derived from excised tumors exhibited increased doxorubicin-induced senescence. As senescence is a determinant of cell responses to anti-neoplastic treatments, these findings suggest PTTG1 as a tumor cell marker to predict anti-neoplastic treatment outcomes.
Conflict of interest statement
Figures
Similar articles
-
EZH2 mediates lidamycin-induced cellular senescence through regulating p21 expression in human colon cancer cells.Cell Death Dis. 2016 Nov 24;7(11):e2486. doi: 10.1038/cddis.2016.383. Cell Death Dis. 2016. PMID: 27882937 Free PMC article.
-
Depletion of securin induces senescence after irradiation and enhances radiosensitivity in human cancer cells regardless of functional p53 expression.Int J Radiat Oncol Biol Phys. 2010 Jun 1;77(2):566-74. doi: 10.1016/j.ijrobp.2009.12.013. Int J Radiat Oncol Biol Phys. 2010. PMID: 20457353
-
Trichostatin A causes p53 to switch oxidative-damaged colorectal cancer cells from cell cycle arrest into apoptosis.J Cell Mol Med. 2008 Apr;12(2):607-21. doi: 10.1111/j.1582-4934.2007.00136.x. J Cell Mol Med. 2008. PMID: 18419600 Free PMC article.
-
Transcriptional targets for pituitary tumor-transforming gene-1.J Mol Endocrinol. 2009 Nov;43(5):179-85. doi: 10.1677/JME-08-0176. Epub 2009 May 11. J Mol Endocrinol. 2009. PMID: 19433493 Review.
-
Pituitary senescence: the evolving role of Pttg.Mol Cell Endocrinol. 2010 Sep 15;326(1-2):55-9. doi: 10.1016/j.mce.2010.02.012. Epub 2010 Feb 12. Mol Cell Endocrinol. 2010. PMID: 20153804 Free PMC article. Review.
Cited by
-
Radiation-induced senescence in securin-deficient cancer cells promotes cell invasion involving the IL-6/STAT3 and PDGF-BB/PDGFR pathways.Sci Rep. 2013;3:1675. doi: 10.1038/srep01675. Sci Rep. 2013. PMID: 23591770 Free PMC article.
-
Targeting the PTTG1 oncogene impairs proliferation and invasiveness of melanoma cells sensitive or with acquired resistance to the BRAF inhibitor dabrafenib.Oncotarget. 2017 Dec 9;8(69):113472-113493. doi: 10.18632/oncotarget.23052. eCollection 2017 Dec 26. Oncotarget. 2017. PMID: 29371923 Free PMC article.
-
Falcarindiol Enhances Cisplatin Chemosensitivity of Hepatocellular Carcinoma via Down-Regulating the STAT3-Modulated PTTG1 Pathway.Front Pharmacol. 2021 May 7;12:656697. doi: 10.3389/fphar.2021.656697. eCollection 2021. Front Pharmacol. 2021. PMID: 34025420 Free PMC article.
-
Radiation induces senescence and a bystander effect through metabolic alterations.Cell Death Dis. 2014 May 22;5(5):e1255. doi: 10.1038/cddis.2014.220. Cell Death Dis. 2014. PMID: 24853433 Free PMC article.
-
RNAi-mediated knockdown of pituitary tumor- transforming gene-1 (PTTG1) suppresses the proliferation and invasive potential of PC3 human prostate cancer cells.Braz J Med Biol Res. 2012 Nov;45(11):995-1001. doi: 10.1590/s0100-879x2012007500126. Epub 2012 Aug 9. Braz J Med Biol Res. 2012. PMID: 22872288 Free PMC article.
References
-
- Pei L, Melmed S. Isolation and characterization of a pituitary tumor-transforming gene (PTTG). Mol Endocrinol. 1997;11:433–441. - PubMed
-
- Vlotides G, Eigler T, Melmed S. Pituitary tumor-transforming gene: physiology and implications for tumorigenesis. Endocr Rev. 2007;28:165–186. - PubMed
-
- Ogbagabriel S, Fernando M, Waldman FM, Bose S, Heaney AP. Securin is overexpressed in breast cancer. Mod Pathol. 2005;18:985–990. - PubMed
-
- Thompson AD, 3rd, Kakar SS. Insulin and IGF-1 regulate the expression of the pituitary tumor transforming gene (PTTG) in breast tumor cells. FEBS Lett. 2005;579:3195–3200. - PubMed
-
- Solbach C, Roller M, Fellbaum C, Nicoletti M, Kaufmann M. PTTG mRNA expression in primary breast cancer: a prognostic marker for lymph node invasion and tumor recurrence. Breast. 2004;13:80–81. - PubMed
Publication types
MeSH terms
Substances
Grants and funding
LinkOut - more resources
Full Text Sources
Other Literature Sources
Research Materials
Miscellaneous
