Associations of age, gender and body mass with 1H MR-observed brain metabolites and tissue distributions
- PMID: 21858879
- PMCID: PMC3313016
- DOI: 10.1002/nbm.1775
Associations of age, gender and body mass with 1H MR-observed brain metabolites and tissue distributions
Abstract
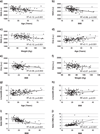
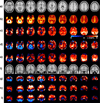
Recent reports have indicated that a measure of adiposity, the body mass index (BMI), is associated with MR-observed brain metabolite concentrations and tissue volume measures. In addition to indicating possible associations between brain metabolism, BMI and cognitive function, the inclusion of BMI as an additional subject selection criterion could potentially improve the detection of metabolic and structural differences between subjects and study groups. In this study, a retrospective analysis of 140 volumetric MRSI datasets was carried out to investigate the value of including BMI in the subject selection relative to age and gender. The findings replicate earlier reports of strong associations of N-acetylaspartate, creatine, choline and gray matter with age and gender, with additional observations of slightly increased spectral linewidth with age and in female relative to male subjects. Associations of metabolite levels, linewidth and gray matter volume with BMI were also observed, although only in some regions. Using voxel-based analyses, it was also observed that the patterns of the relative changes of metabolites with BMI matched those of linewidth with BMI or weight, and that residual magnetic field inhomogeneity and measures of spectral quality were influenced by body weight. It is concluded that, although associations of metabolite levels and tissue distributions with BMI occur, these may be attributable to issues associated with data acquisition and analysis; however, an organic origin for these findings cannot be specifically excluded. There is, however, sufficient evidence to warrant the inclusion of body weight as a subject selection parameter, secondary to age, and as a factor in data analysis for MRS studies of some brain regions.
Copyright © 2011 John Wiley & Sons, Ltd.
Figures


Similar articles
-
Mapping of brain metabolite distributions by volumetric proton MR spectroscopic imaging (MRSI).Magn Reson Med. 2009 Mar;61(3):548-59. doi: 10.1002/mrm.21875. Magn Reson Med. 2009. PMID: 19111009 Free PMC article.
-
Short echo time multislice proton magnetic resonance spectroscopic imaging in human brain: metabolite distributions and reliability.Magn Reson Imaging. 2001 Oct;19(8):1073-80. doi: 10.1016/s0730-725x(01)00441-6. Magn Reson Imaging. 2001. PMID: 11711231
-
Relative metabolite concentrations and ratios determined by use of 3-T region-specific proton magnetic resonance spectroscopy of the brain of healthy Beagles.Am J Vet Res. 2013 Oct;74(10):1291-303. doi: 10.2460/ajvr.74.10.1291. Am J Vet Res. 2013. PMID: 24066913
-
In vivo spectroscopic quantification of the N-acetyl moiety, creatine, and choline from large volumes of brain gray and white matter: effects of normal aging.Magn Reson Med. 1999 Feb;41(2):276-84. doi: 10.1002/(sici)1522-2594(199902)41:2<276::aid-mrm10>3.0.co;2-8. Magn Reson Med. 1999. PMID: 10080274
-
Age dependence of regional proton metabolites T2 relaxation times in the human brain at 3 T.Magn Reson Med. 2008 Oct;60(4):790-5. doi: 10.1002/mrm.21715. Magn Reson Med. 2008. PMID: 18816831 Free PMC article.
Cited by
-
Impact of glucose metabolism on the developing brain.Front Endocrinol (Lausanne). 2022 Dec 23;13:1047545. doi: 10.3389/fendo.2022.1047545. eCollection 2022. Front Endocrinol (Lausanne). 2022. PMID: 36619556 Free PMC article. Review.
-
EEG alpha activity increased in response to transcutaneous electrical nervous stimulation in young healthy subjects but not in the healthy elderly.PeerJ. 2020 Jan 7;8:e8330. doi: 10.7717/peerj.8330. eCollection 2020. PeerJ. 2020. PMID: 31938578 Free PMC article.
-
Age-related Brain Metabolic Changes up to Seventh Decade in Healthy Humans : Whole-brain Magnetic Resonance Spectroscopic Imaging Study.Clin Neuroradiol. 2020 Sep;30(3):581-589. doi: 10.1007/s00062-019-00814-z. Epub 2019 Jul 26. Clin Neuroradiol. 2020. PMID: 31350597 Free PMC article.
-
Statistical mapping of metabolites in the medial wall of the brain: a proton echo planar spectroscopic imaging study.Hum Brain Mapp. 2015 Mar;36(3):852-61. doi: 10.1002/hbm.22669. Epub 2014 Oct 23. Hum Brain Mapp. 2015. PMID: 25338521 Free PMC article.
-
Regional Metabolite Concentrations in Aging Human Brain: Comparison of Short-TE Whole Brain MR Spectroscopic Imaging and Single Voxel Spectroscopy at 3T.Clin Neuroradiol. 2020 Jun;30(2):251-261. doi: 10.1007/s00062-018-00757-x. Epub 2019 Jan 18. Clin Neuroradiol. 2020. PMID: 30659340 Free PMC article.
References
-
- Good CD, Johnsrude IS, Ashburner J, Henson RN, Friston KJ, Frackowiak RS. A voxel-based morphometric study of ageing in 465 normal adult human brains. Neuroimage. 2001;14:21–36. - PubMed
Publication types
MeSH terms
Substances
Grants and funding
LinkOut - more resources
Full Text Sources
Medical

