

Two-photon STED spectral determination for a new V-shaped organic fluorescent probe with efficient two-photon absorption
- PMID: 21858908
- PMCID: PMC3354632
- DOI: 10.1002/cphc.201100456
Two-photon STED spectral determination for a new V-shaped organic fluorescent probe with efficient two-photon absorption
Abstract
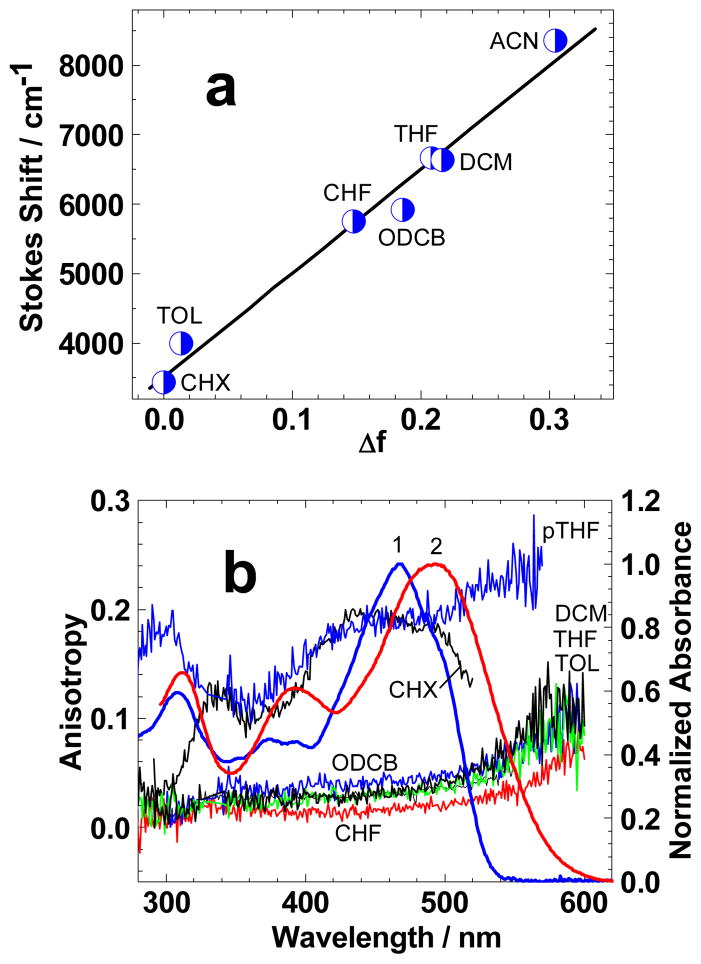
Two-photon stimulated emission depletion (STED) cross sections were determined over a broad spectral range for a novel two-photon absorbing organic molecule, representing the first such report. The synthesis, comprehensive linear photophysical, two-photon absorption (2PA), and stimulated emission properties of a new fluorene-based compound, (E)-2-{3-[2-(7-(diphenylamino)-9,9-diethyl-9H-fluoren-2-yl)vinyl]-5-methyl-4-oxocyclohexa-2,5-dienylidene} malononitrile (1), are presented. Linear spectral parameters, including excitation anisotropy and fluorescence lifetimes, were obtained over a broad range of organic solvents at room temperature. The degenerate two-photon absorption (2PA) spectrum of 1 was determined with a combination of the direct open-aperture Z-scan and relative two-photon-induced fluorescence methods using 1 kHz femtosecond excitation. The maximum value of the 2PA cross section ~1700 GM was observed in the main, long wavelength, one-photon absorption band. One- and two-photon stimulated emission spectra of 1 were obtained over a broad spectral range using a femtosecond pump-probe technique, resulting in relatively high two-photon stimulated emission depletion cross sections (~1200 GM). A potential application of 1 in bioimaging was demonstrated through one- and two-photon fluorescence microscopy images of HCT 116 cells incubated with micelle-encapsulated dye.
Copyright © 2011 WILEY-VCH Verlag GmbH & Co. KGaA, Weinheim.
Figures


Similar articles
-
Two-photon absorption and time-resolved stimulated emission depletion spectroscopy of a new fluorenyl derivative.Chemphyschem. 2012 Oct 22;13(15):3481-91. doi: 10.1002/cphc.201200405. Epub 2012 Aug 7. Chemphyschem. 2012. PMID: 22887914 Free PMC article.
-
A superfluorescent fluorenyl probe with efficient two-photon absorption.Phys Chem Chem Phys. 2011 Mar 14;13(10):4303-10. doi: 10.1039/c0cp01511c. Epub 2011 Jan 21. Phys Chem Chem Phys. 2011. PMID: 21253638
-
New two-photon-absorbing probe with efficient superfluorescent properties.J Phys Chem B. 2010 Nov 11;114(44):14087-95. doi: 10.1021/jp107343k. J Phys Chem B. 2010. PMID: 20949957 Free PMC article.
-
Lighting the Way to See Inside Two-Photon Absorption Materials: Structure-Property Relationship and Biological Imaging.Materials (Basel). 2017 Feb 23;10(3):223. doi: 10.3390/ma10030223. Materials (Basel). 2017. PMID: 28772584 Free PMC article. Review.
-
Multiphoton excited fluorescent materials for frequency upconversion emission and fluorescent probes.Adv Mater. 2014 Aug 20;26(31):5400-28. doi: 10.1002/adma.201400084. Epub 2014 Jul 1. Adv Mater. 2014. PMID: 24981591 Review.
Cited by
-
Near-infrared-emitting squaraine dyes with high 2PA cross-sections for multiphoton fluorescence imaging.ACS Appl Mater Interfaces. 2012 Jun 27;4(6):2847-54. doi: 10.1021/am300467w. Epub 2012 May 16. ACS Appl Mater Interfaces. 2012. PMID: 22591003 Free PMC article.
-
RGD-conjugated two-photon absorbing near-IR emitting fluorescent probes for tumor vasculature imaging.Org Biomol Chem. 2015 Nov 21;13(43):10716-25. doi: 10.1039/c5ob01536g. Org Biomol Chem. 2015. PMID: 26351137 Free PMC article.
-
Computer aided chemical design: using quantum chemical calculations to predict properties of a series of halochromic guaiazulene derivatives.R Soc Open Sci. 2016 Nov 23;3(11):160373. doi: 10.1098/rsos.160373. eCollection 2016 Nov. R Soc Open Sci. 2016. PMID: 28018614 Free PMC article.
-
Transient excited-state absorption and gain spectroscopy of a two-photon absorbing probe with efficient superfluorescent properties.J Phys Chem C Nanomater Interfaces. 2012 May 24;116(20):11261-11271. doi: 10.1021/jp302274v. Epub 2012 May 14. J Phys Chem C Nanomater Interfaces. 2012. PMID: 22707998 Free PMC article.
-
Two-photon absorption and time-resolved stimulated emission depletion spectroscopy of a new fluorenyl derivative.Chemphyschem. 2012 Oct 22;13(15):3481-91. doi: 10.1002/cphc.201200405. Epub 2012 Aug 7. Chemphyschem. 2012. PMID: 22887914 Free PMC article.
References
-
- Denk W, Strickler JH, Webb WW. Science. 1990;248:73–76. - PubMed
-
- Moneron G, Hell SW. Opt Express. 2009;17:14567–14573. - PubMed
-
- Macoas E, Marcelo G, Pinto S, Caneque T, Cuadro AM, Vaquero JJ, Martinho JMG. Chem Commun. 2011;47:7374–7376. - PubMed
-
- Kawata S, Kawata Y. Chem Rev. 2000;100:1777–1788. - PubMed
Publication types
MeSH terms
Substances
Grants and funding
LinkOut - more resources
Full Text Sources
Other Literature Sources
