. 2011 Jul;38(7):4112-26.
doi: 10.1118/1.3599751.

A theoretical and experimental evaluation of the microangiographic fluoroscope: A high-resolution region-of-interest x-ray imager

Affiliations

A theoretical and experimental evaluation of the microangiographic fluoroscope: A high-resolution region-of-interest x-ray imager

Amit Jain et al. Med Phys. 2011 Jul.

Erratum in

Abstract

Purpose: The increasing need for better image quality and high spatial resolution for successful endovascular image-guided interventions (EIGIs) and the inherent limitations of the state-of-the-art detectors provide motivation to develop a detector system tailored to the specific, demanding requirements of neurointerventional applications.

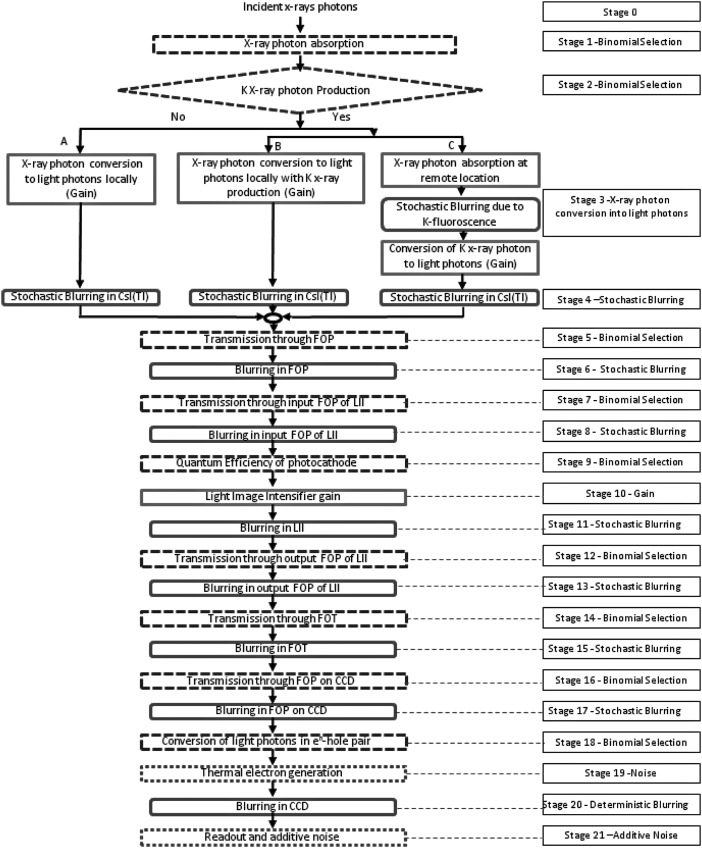
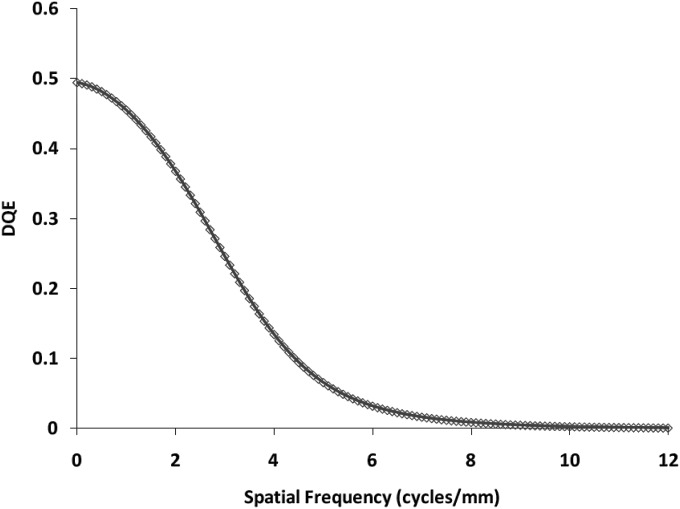
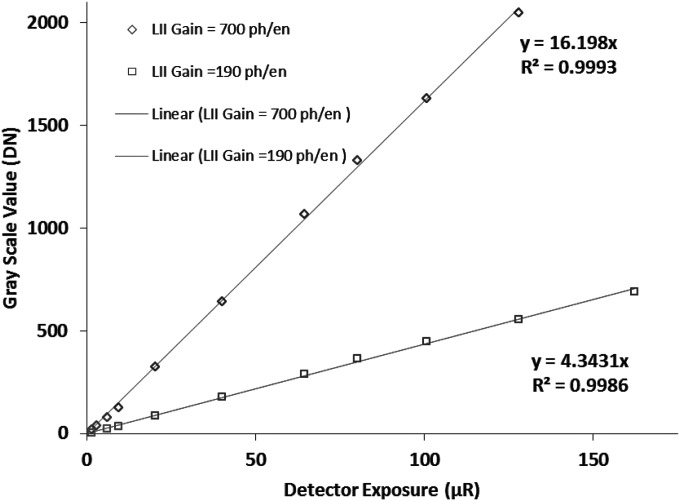
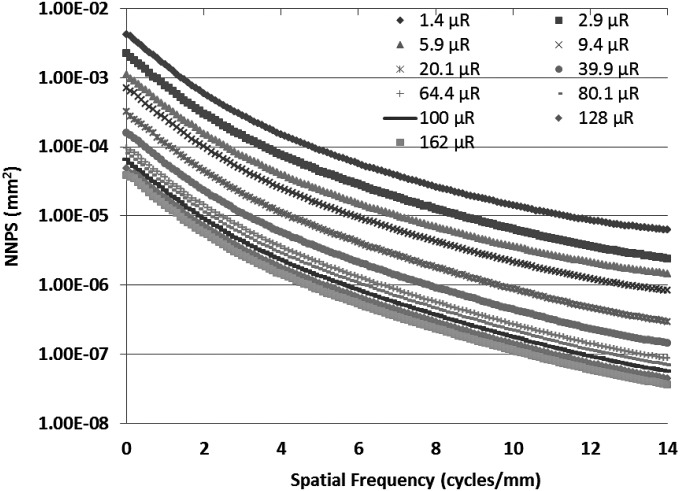
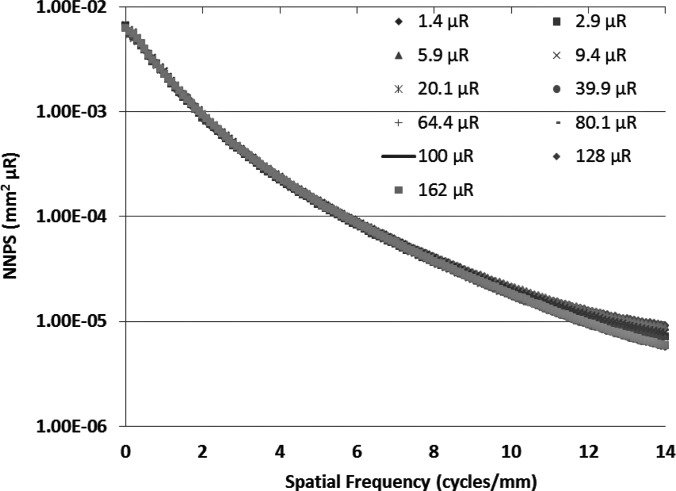
Method: A microangiographic fluoroscope (MAF) was developed to serve as a high-resolution, region-of-interest (ROI) x-ray imaging detector in conjunction with large lower-resolution full field-of-view (FOV) state-of-the-art x-ray detectors. The newly developed MAF is an indirect x-ray imaging detector capable of providing real-time images (30 frames per second) with high-resolution, high sensitivity, no lag and low instrumentation noise. It consists of a CCD camera coupled to a Gen 2 dual-stage microchannel plate light image intensifier (LII) through a fiber-optic taper. A 300 microm thick CsI(T1) phosphor serving as the front end is coupled to the LII. The LII is the key component of the MAF and the large variable gain provided by it enables the MAF to operate as a quantum-noise-limited detector for both fluoroscopy and angiography.

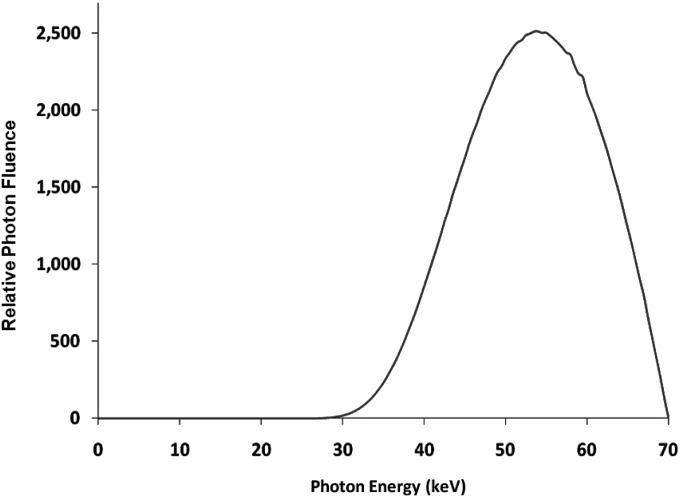
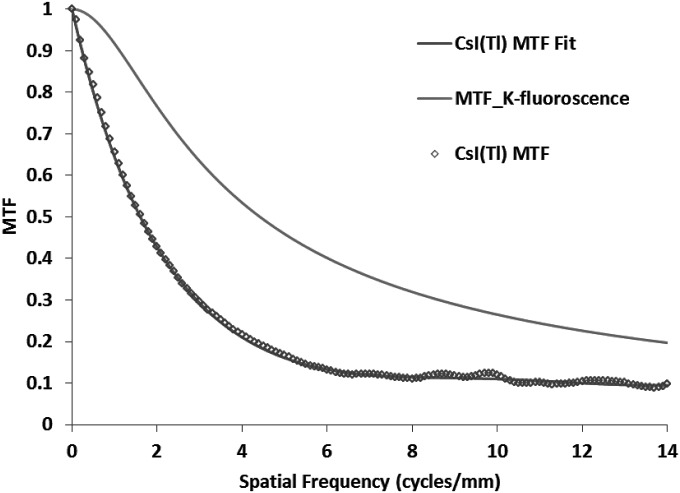
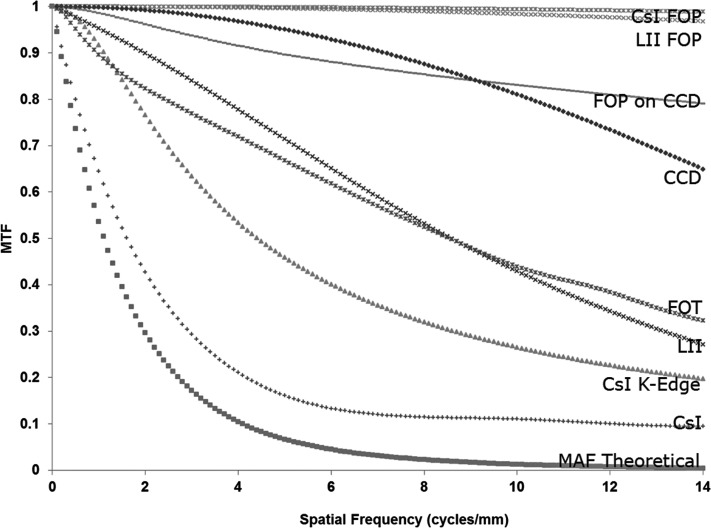
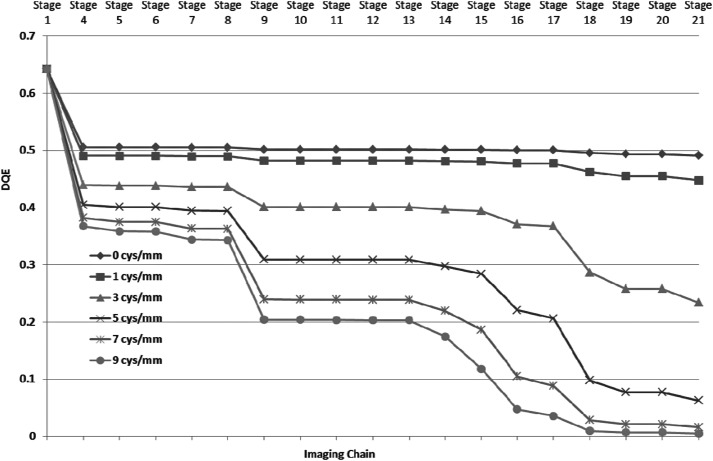
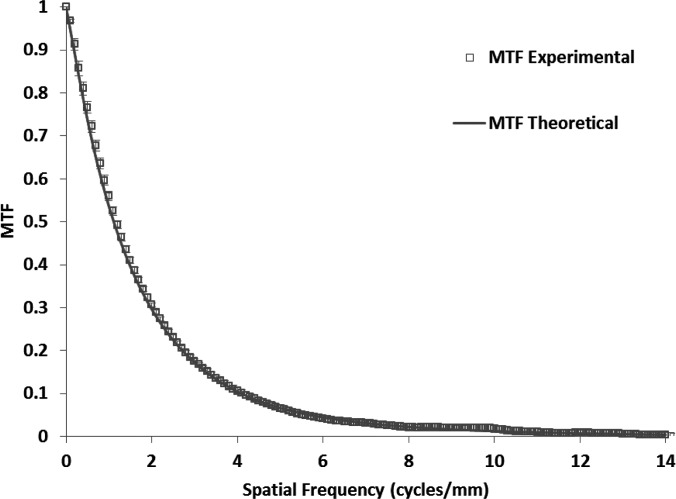
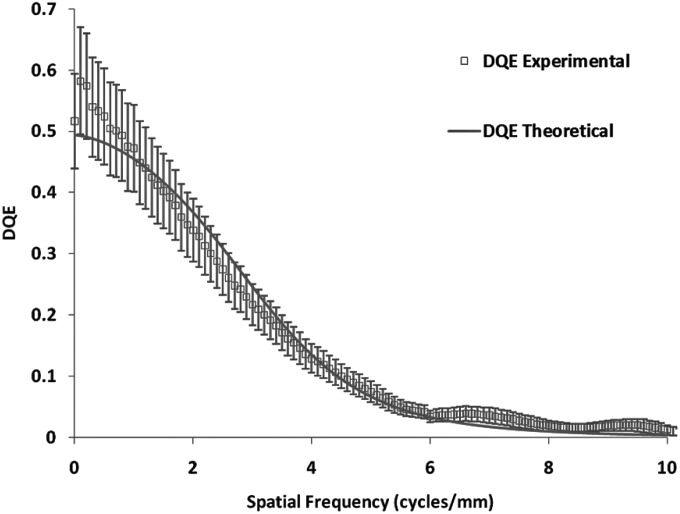
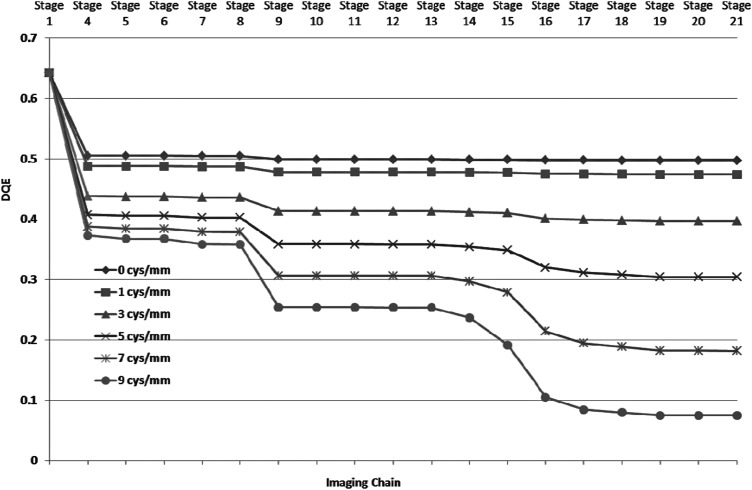
Results: The linear cascade model was used to predict the theoretical performance of the MAF, and the theoretical prediction showed close agreement with experimental findings. Linear system metrics such as MTF and DQE were used to gauge the detector performance up to 10 cycles/mm. The measured zero frequency DQE(0) was 0.55 for an RQA5 spectrum. A total of 21 stages were identified for the whole imaging chain and each stage was characterized individually.

Conclusions: The linear cascade model analysis provides insight into the imaging chain and may be useful for further development of the MAF detector. The preclinical testing of the prototype detector in animal procedures is showing encouraging results and points to the potential for significant impact on EIGIs when used in conjunction with a state-of-art flat panel detector (FPD).


Figures

Figure 1
Figure 1
MAF Schematic. LII—light image intensifier; FOP—fiber-optic plate.
Figure 2
Figure 2
Schematic of stages for cascade model for MAF.
Figure 3
Figure 3
RQA5 X-ray Spectrum used for the experiments.
Figure 4
Figure 4
Measured modulation transfer function for a 300 μm thick CsI(Tl) phosphor and calculated K-fluorescence re-absorption. Analytical fit for the CsI MTF is also shown in the figure.
Figure 5
Figure 5
Theoretically estimated modulation transfer function of the MAF and the modulation transfer functions for its various components including the FOPs, FOT, and CCD. MTFs for the FOT and FOP on the CCD were measured, while all others are supplied by the manufacturer. The CsI K-edge MTF is the K-fluorescence MTF (Used for the blurring in branch “C”).
Figure 6
Figure 6
Theoretically estimated DQE of MAF for 162 μR detector exposure with LII gain of 700 photons∕electrons.
Figure 7
Figure 7
DQE values at different stages for six different spatial frequencies. The stage numbers are the same as shown in Fig. 2.
Figure 8
Figure 8
Characteristic response curves for the MAF. The mean digital numbers of the flat-field images are plotted versus detector input exposure for two different LII nominal gains (700 photons∕electron and 190 photons∕electron). The graphs show the linear regression fits to the data and demonstrate the linearity of the MAF with exposure for different LII gains.
Figure 9
Figure 9
Comparison of experimental and theoretically estimated MTFs for the MAF. The error bars for the experimentally measured MTF shows the variation between different measurements.
Figure 10
Figure 10
The measured normalized noise power spectra for the MAF at various exposures are shown.
Figure 11
Figure 11
Measured NNPS normalized to the input exposure for the MAF at various exposures are shown. The same shape of the NNPS curves at different exposures suggests similar DQE at different exposures.
Figure 12
Figure 12
Comparison of experimental and theoretically estimated DQEs for the MAF. The error bars for the experimentally measured DQE shows the variation between different measurements.
Figure 13
Figure 13
DQE values at different stages for six different spatial frequencies for the MAF with a modified design [i.e., the HL type CsI is replaced with an HR type CsI and the front illuminated CCD (Quantum efficiency ∼23%) is replaced by a back illuminated CCD (Quantum efficiency ∼92%)]. The stage numbers are the same as shown in Fig. 2.
Figure 14
Figure 14
Images of a deployed stent in a rabbit. The left image is taken with an FPD and the right image is taken with the MAF for the same animal and orientation. Additional details visible in the image taken with the MAF include the stent tines and hence the edge of the stent and the markers. Because the stent was deployed using the MAF as guidance, only the right image contains the guide wire. The exposure used was the same for both detectors.

References

    1. Rudin S., Bednarek D. R., and Hoffmann K. R., “Endovascular image-guided interventions (EIGIs),” Med. Phys. 35 (1), 301–309 (2008).10.1118/1.2821702 - DOI - PMC - PubMed
    1. Adamson J., Beswick A., and Ebrahim S., “Is stroke the most common cause of disability?,” J. Stroke Cerebrovasc. Dis. 13 (4), 171–177 (2004);10.1016/j.jstrokecerebrovasdis.2004.06.003 - DOI - PubMed
    1. Dubinsky R. and Lai S., “Mortality of stroke patients treated with thromolysis: Analysis of a nationwide inpatient sample,” Neurology 66 u(11), 1742–1744 (2006).10.1212/01.wnl.0000218306.35681.38 - DOI - PubMed
    1. Higashida R., Lahue B., Torbey M., Hopkins L. N., Leip E., and Hanley D., “Treatment of unruptured intracranial aneurysms: A nationwide assessment of effectiveness,” Am. J. Neuroradiol. 28, 146–151 (2007). - PMC - PubMed
    1. Rammohan C., Erdogan A., and Davidson C. J., “New stent technologies: Coated, covered, and bifurcated stents,” Controversies Consensus Imaging Intervention, 4–9 (2003).

Publication types

MeSH terms