

doi: 10.1186/gb-2011-12-8-r83.
Cistrome: an integrative platform for transcriptional regulation studies
Affiliations
- PMID: 21859476
- PMCID: PMC3245621
- DOI: 10.1186/gb-2011-12-8-r83
Item in Clipboard
Cistrome: an integrative platform for transcriptional regulation studies
Genome Biol.
.
Abstract
The increasing volume of ChIP-chip and ChIP-seq data being generated creates a challenge for standard, integrative and reproducible bioinformatics data analysis platforms. We developed a web-based application called Cistrome, based on the Galaxy open source framework. In addition to the standard Galaxy functions, Cistrome has 29 ChIP-chip- and ChIP-seq-specific tools in three major categories, from preliminary peak calling and correlation analyses to downstream genome feature association, gene expression analyses, and motif discovery. Cistrome is available at http://cistrome.org/ap/.
Figures
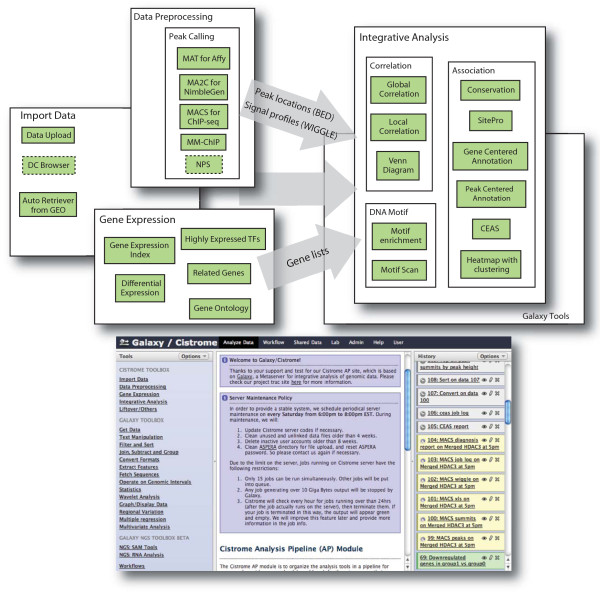
Workflow within the Cistrome analysis platform. Cistrome functions can be divided into three categories: data preprocessing, gene expression and integrative analysis. A general workflow using Cistrome is to upload datasets, preprocess them using peak calling tools to generate peak locations in BED format and signal profiles in WIGGLE format, upload gene expression data to produce specific gene lists, and then use various integrative analysis tools to generate figures and reports. The bottom figure shows the web interface of the Cistrome platform based on the Galaxy framework. The left panel shows available tools, the middle panel shows messages, tool options, or result details, and the right panel shows the datasets organized in the user's history, including datasets that have been or are being processed (in green and yellow, respectively), or waiting in the queue (in gray). CEAS,; DC, Data Collection module; GEO, Gene Expression Omnibus; NPS, Nucleosome Positioning from Sequencing; TF, transcription factor.
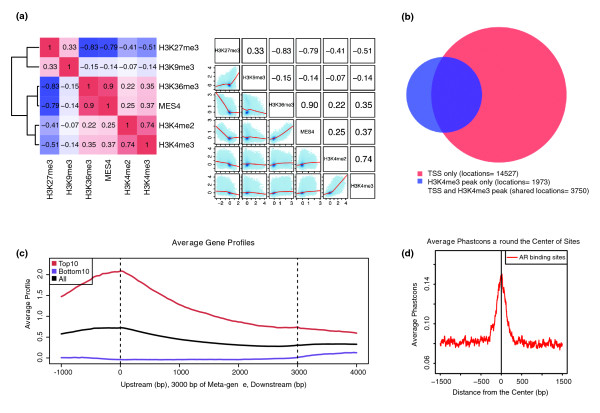
Correlation and association tools. (a) Correlation plots using different histone marks in C. elegans early embryos [43]. Cistrome correlation tools can generate either a heatmap with hierarchical clustering according to pair-wise correlation coefficients or a grid of scatterplots. (b) Venn diagram showing the overlap of H3K4me3 peaks (in blue) with transcription start sites (TSS) for all the genes (in red) in the C. elegans genome. (c) Meta-gene plot generated by CEAS showing the H3K4me3 signals enriched at gene promoter regions; the top expressed genes (red) have higher H3K4me3 signals than the bottom expressed genes (purple). (d) Conservation plot showing that the human androgen receptor (AR) binding sites from ChIP-chip [24] are more conserved than their flanking regions in placental mammals.
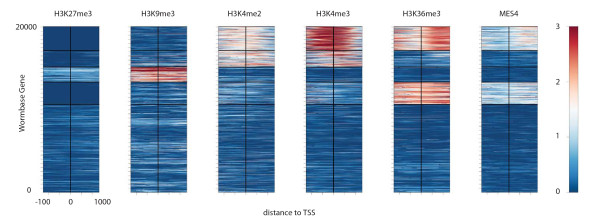
Heatmap analysis with k-means clustering. By combining H3K27me3, H3K9me3, H3K4me3, H3K4me2, H3K36me3 and MES-4 (the histone H3K36 methyltransferase) ChIP-chip signals, as in Figure 2a, the Cistrome heatmap tool separates the ± 1-kbp regions for all of the C. elegans TSSs into five clusters using k-means clustering. From top to bottom, the clusters are as follows: (1) about 3,000 TSSs related to active genes have high H3K4me3 upstream of the TSSs and high H3K36me3 downstream of the TSSs; (2) about 2,000 TTSs have slightly lower H3K4me3 levels downstream of the TSSs and no significant K36me3 enrichment; (3) about 2,000 TSSs have high H3K27me3 and H3K9me3 related to inactive genes; (4) about 2,500 TTSs with low H3K27me3, moderate H3K4me3 and high H3K36me3 enrichment around the TTS related to genes in operons; and (5) about 10,000 TTSs have no strong marks.
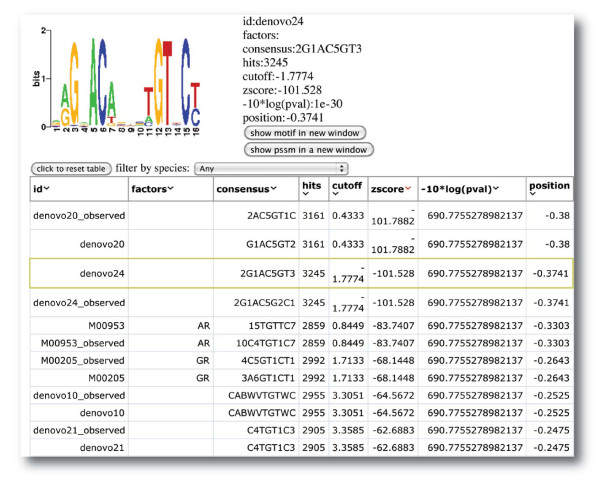
Cistrome SeqPos motif analysis. A screenshot of the SeqPos output. The enriched motifs at the androgen receptor binding sites without FoxA1 binding are displayed in an interactive HTML page. When the user clicks on the row of a particular motif, the motif logo and detail information are shown at the top of the page.
References
Publication types
MeSH terms
Substances
Grants and funding
LinkOut - more resources
Full Text Sources
Other Literature Sources
Medical
