. 2011 Aug 29;208(9):1823-34.
doi: 10.1084/jem.20101805. Epub 2011 Aug 22.

Extracellular ATP acts on P2Y2 purinergic receptors to facilitate HIV-1 infection

Affiliations

Extracellular ATP acts on P2Y2 purinergic receptors to facilitate HIV-1 infection

Claire Séror et al. J Exp Med. .

Abstract

Extracellular adenosine triphosphate (ATP) can activate purinergic receptors of the plasma membrane and modulate multiple cellular functions. We report that ATP is released from HIV-1 target cells through pannexin-1 channels upon interaction between the HIV-1 envelope protein and specific target cell receptors. Extracellular ATP then acts on purinergic receptors, including P2Y2, to activate proline-rich tyrosine kinase 2 (Pyk2) kinase and transient plasma membrane depolarization, which in turn stimulate fusion between Env-expressing membranes and membranes containing CD4 plus appropriate chemokine co-receptors. Inhibition of any of the constituents of this cascade (pannexin-1, ATP, P2Y2, and Pyk2) impairs the replication of HIV-1 mutant viruses that are resistant to conventional antiretroviral agents. Altogether, our results reveal a novel signaling pathway involved in the early steps of HIV-1 infection that may be targeted with new therapeutic approaches.


Figures

Figure 1.
Figure 1.
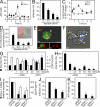
ATP release through pannexin-1 hemichannels modulates interactions of HIV-1 with target cells. (A) ATP released by CD4+CXCR4+ cells during HIVNL43 infection (MOI = 1; black circle) or in the absence of infection (white circle) was determined at different time points by ATP-dependent bioluminescence in three independent experiments. One representative experiment is shown (mean ± SEM of triplicates; *, P < 0.01). (B) CD4+CXCR4+ cells expressing a Tat-inducible β-galactosidase (β-gal) reporter gene were infected with HIVNL43 (MOI = 1) during 48 h in the presence of different concentrations of apyrase. Then, the medium containing apyrase was removed, replaced by complete medium, and target cell infection was determined 48 h after infection (mean ± SEM; three independent experiments; *, P < 0.05). (C) ATP release was expressed as a fold increase of ATP release during co-culture of HIV-1 target cells with Env+ or Env cells. Error bars indicate SEM of three independent determinations (*, P < 0.05). (D) Effect of ATP depletion by apyrase on HIV-1 envelope mediated actin polymerization. Actin polymerization in pairs of interacting cells was determined in three independent experiments (means ± SEM; *, P < 0.05) by fluorescence microscopy. The inset illustrates actin polymerization (green) between an Env+ cell (red) and an interacting CD4+CXCR4+ cell (bar, 5 µm). (E) Localization of pannexin-1 at the contact site between primary HIV-1–infected lymphoblasts (green) and primary uninfected lymphoblasts, visualized by confocal microscopy. The arrowhead points to pannexin-1 accumulation (red) at the interface between primary infected and uninfected lymphoblasts (bar, 5 µm). A representative micrograph with merged images of xz (bar, 4 µm) and yz (bar, 1 µm) optical sections are shown. (F) Polarization of pannexin-1 (red) on the virological synapse between HIV-1–infected lymphoblasts (blue) and that of HIV-1–infected and uninfected cells. Arrowheads highlight the colocalization between pannexin-1 and the HIV-1 envelope glycoprotein gp41 (green; bar, 5 µm). The images in E and F are representative of at least 40 cells in three independent experiments. (G) CEM cells were infected during 6 d with HIVNL43 (MOI = 1) in the presence of different concentrations of DIDS or SITS. Effects on target cell survival and on p24 antigen release were determined. Error bars indicate SD of three independent determinations (*, P < 0.01; **, P < 0.001). (H) CD4+CXCR4+ cells expressing Tat-inducible β-gal reporter gene were infected with HIVNL43 (MOI = 1) during 3 h in the presence of the indicated concentrations of the indicated inhibitors. The medium was removed, replaced by complete medium, and target cell infectivity was determined (means ± SEM; n = 3; *, P < 0.01). (I) CD4+CXCR4+ cells were transfected during 48 h with siRNAs specific for pannexin-1 or control siRNA and then infected with HIVNL43 (MOI = 1). Pannexin-1 mRNA expression was measured by quantitative real-time RT-PCR. The effect of pannexin-1 depletion on p24 antigen release was determined as described in Materials and methods (means ± SEM; n = 3; *, P < 0.01; **, P < 0.001). (J and K) Cells were transfected with siRNA as in I. ATP release and HIV-1 infection were determined after 3 h (by ATP-dependent bioluminescence) and after 48 h (using CD4+CXCR4+ cells that contain a Tat-inducible β-Gal reporter), respectively. Results were obtained in three independent experiments (mean ± SEM; *, P < 0.05).
Figure 2.
Figure 2.
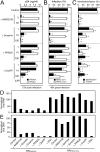
Purinergic receptors modulate HIV-1 infection. (A–C) Effects of CXCR4 receptor antagonist AMD3100 and the general P2 receptor antagonists suramin, PPADS, and OxATP on p24 release (A), host cell infectivity (B), and hemifusion/fusion (C), as observed during infection of PHA+IL-2–stimulated human PBMCs with HIVNDK and HIVBaL (A), during infection of CD4+CXCR4+ cells with HIVNL43WT and HIVNL43ΔEnv (B), or during co-culture of Env+ cells with HIV-1 target cells (C). Columns in A–C show means ± SEM (n = 3; *, P < 0.05). (D and E) Effects of 5 µM AMD3100, 10 UI/ml apyrase, 10 µM suramin, 100 µM PPADS, 100 µM OxATP, and 500 nM efavirenz (Efav) on viral RNA expression and on total viral DNA expression of wild-type (HIVNL43WT) or VSVG pseudotyped (HIVNL43ΔEnv) HIV-1 in CD4+CXCR4+ cells. Viral RNA was detected by quantitative PCR. Note that the internalization of pseudotyped HIVNL43ΔEnv virus was not reduced by these inhibitors (D). Total viral DNA was determined by PCR and results were normalized with respect to GAPDH (E). Efavirenz was used as an internal control of reverse transcription activity inhibition. The results are representative of three independent experiments.
Figure 3.
Figure 3.
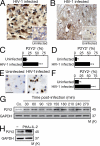
Detection of P2Y2 expression during HIV-1 infection. (A–D) Immunohistochemical P2Y2 detection in lymph node biopsies (A) and frontal cortex biopsies (B) obtained from HIV-1–infected patients. The insets illustrate the absence of staining in lymph node and frontal cortex biopsies from uninfected patients (bars, 50 µm). The percentage of P2Y2+ cells was determined in lymph node (C) and frontal cortex (D) biopsies. Error bars represent means ± SEM (n = 5; *, P < 0.01). (E and F) P2Y2 detection in PBMCs obtained from uninfected or untreated HIV-1–infected patients. Representative microphotographs are shown in E (bars, 20 µm) and quantitative data are shown in F (mean ± SEM; n = 3; *, P < 0.05). (G) Primary lymphoblasts were infected with HIVNDK (MOI=1) for the indicated periods. Then P2Y2 expression was evaluated by immunoblotting. Representative immunoblots of three independent experiments are shown. (H) Expression of P2Y2 on PBMC (−) and on PHA+IL-2–activated PBMC was determined in three independent experiments and one representative immunoblot is shown.
Figure 4.
Figure 4.
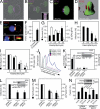
Role of P2Y2 in HIV-1 infection. (A–D) Detection of P2Y2 (pink, A–C; red, D) during the interaction between HIV-1–infected lymphoblasts (green) and uninfected lymphoblasts, as visualized by confocal microscopy. The inset in B represents a yz optical section and shows the circular distribution of P2Y2. Contrast phase in A and B revealed interacting lymphoblasts. 3D projection (C) and 3D reconstruction (D) of merged images unraveled a ring-like distribution of P2Y2 between interacting lymphoblasts (bars, 5 µm). (E) Detection of P2Y2 on virological synapse mediated by HIV-1 envelope between interacting lymphoblasts. Note the colocalization between P2Y2 (in red) and the HIV-1 envelope glycoprotein gp41 (in green) between HIV-1–infected lymphoblasts (in blue) and uninfected lymphoblasts (arrowhead). Representative micrographs of xy (bar, 5 µm), xz (bar, 4 µm), and yz (bar, 1 µm) optical sections are shown. Images in A–E are representative of at least four independent experiments. (F) Frequency of P2Y2 polarization at the virological synapse induced by HIV-1 between lymphoblasts. Data in F are means ± SEM of three independent experiments (*, P < 0.05). (G) Lymphocytic T CEM cells were infected during 6 d with HIVNL43 (MOI = 1) in the presence of different concentrations of the P2Y2 receptor antagonist kaempferol. Cell survival and p24 release were measured. Error bars indicate SD of three independent determinations (*, P < 0.01; **, P < 0.001). (H) CD4+CXCR4+ cells expressing Tat-inducible β-gal reporter gene were infected with HIVNL43 (MOI = 1) during 3 h in the presence of different kaempferol concentrations. 42 h after infection, the percentage of infected target cells was determined by β-Gal detection (mean ± SEM; n = 3; **, P < 0.001). (I) Effects of kaempferol on Env-induced hemifusion and fusion were determined after 24-h co-culture of CD4+CXCR4+ cells with Env+ cells (means ± SD; n = 3; *, P < 0.01; **, P < 0.001). (J) Representative flow cytometric analysis of intracellular p24 antigen in HIVNDK-infected CEM cells previously transduced with lentiviruses encoding indicated shRNA constructs. Representative profiles of three independent experiments are shown. (K) Cells were treated as in J and intracellular p24 and p24 release into the supernatant were determined (mean ± SD; n = 3; *, P < 0.01). ND, not detectable. P2Y2 expression by shRNA-transduced clones was evaluated by immunoblotting (inset). (L) CD4+CXCR4+ cells expressing Tat-inducible β-gal reporter gene were transfected during 48 h with siRNAs specific for P2Y2 or control siRNA and infected with HIVNL43 (MOI = 1). Then, target cell infectivity was determined (means ± SD; n = 3; *, P < 0.01). Insets show representative immunoblots of three independent experiments. (M) CD4+CXCR4+ cells were transfected with siRNA as in L. After 24 h of co-culture with HIV-1 Env+ cells, hemifusion and fusion induced by HIV-1 envelope were determined (means ± SD; n = 3; *, P < 0.01). (N) CD4+CXCR4+ cells expressing Tat-inducible β-gal reporter gene were transfected with the indicated siRNA and with the wild-type P2Y2 or the P2Y2/4A mutant. Cell fusion mediated by the HIV-1 envelope was then evaluated by determining β-Gal activity during co-culture with HIV-1 Env+ (mean ± SEM; n = 3; *, P < 0.01).
Figure 5.
Figure 5.
P2Y2 controls plasma membrane depolarization during HIV-1 Env–mediated fusion. (A) Plasma membrane depolarization of primary lymphoblasts 1 h after infection with HIVNDK (MOI = 1) was determined by evaluating the increase of fluorescence of DiBac4(3) probe by flow cytometry. Representative profiles of three independent experiments are shown. (B) CD4+CXCR4+ cells were treated with 70 mM KCl or control for 3 h. Plasma membrane depolarization was determined by evaluating the increase of fluorescence of the DiBac4(3) probe. Representative profiles of three independent experiments are shown. (C) Frequency of plasma membrane depolarized CD4+CXCR4+ cells after 3 h of 70 mM KCl treatment (mean ± SEM; n = 3; *, P < 0.05). (D) Effects of 5 µM AMD3100 on HIV-1 Env–induced fusion in the absence or presence of 70 mM KCl. The error bars represent means ± SEM (n = 3; *, P < 0.05). (E) Effects of AMD3100, apyrase, PPADS, and OxATP on plasma membrane depolarization after 1 h of HIVNDK infection. Results were obtained in three independent experiments (mean ± SEM; *, P < 0.05) using the DiBac4(3) probe and flow cytometry. (F) Effects of transfections of human P2Y2 wild-type (P2Y2), P2Y2 mutant (P2Y2/4A) constructs, and siRNA against P2Y2 (siRNA-1 P2Y2) on HIV-1 envelope–induced plasma membrane depolarization were determined as described in A (mean ± SEM; n = 3; *, P < 0.05).
Figure 6.
Figure 6.
P2Y2 induces Pyk2 activation during HIV-1 infection. (A) PHA+IL-2–stimulated human PBMCs were infected with HIVNDK (MOI = 1) for the indicated periods. Pyk2Y402* and Pyk2 expression were determined by immunoblotting. GAPDH expression was used as loading control. Representative immunoblots of three independent experiments are shown. (B) Representative Pyk2Y402* polarization (red) between HIV Env+ cells (green) and CD4+CXCR4+ cells was analyzed by confocal microscopy (bar, 5 µm). The inset in B shows the yz section (bar, 3 µm). (C) Detection of Pyk2Y402* (pink) polarization during interaction between HIV-1–infected lymphoblasts (green) and uninfected lymphoblasts by confocal microscopy (bar, 5 µm). The left inset represents an xz optical section and polarization of Pyk2Y402* between interacting cells (bar, 4 µm). The right inset corresponds to a yz optical section and shows peripheral distribution of Pyk2Y402* in the contact site within conjugates (bar, 3 µm). Images are representative of four independent experiments. (D and E) Frequency of Pyk2Y402* polarization between single cells and conjugates during co-culture of HIV Env+ cells and CD4+CXCR4+ cells (D) or co-culture of HIV-1–infected lymphoblasts and uninfected lymphoblasts (E) was determined in three independent experiments (mean ± SEM; *, P < 0.05). (F–I) Detection of Pyk2Y402* in lymph node sections (F and H) and frontal cortex biopsies (G and I) obtained from HIV-1–infected and uninfected patients (HIV-1–infected bar, 50 µm; HIV-1 uninfected bar, 25 µm). The percentage of Pyk2Y402*+ cells found in lymph node (H) and frontal cortex biopsies (I) was quantified. Error bars represent means ± SEM (*, P < 0.01; n = 5). (J) Correlation between Pyk2Y402* detected on PBMCs and viremia obtained from untreated HIV-1 carriers. The p-value corresponds to the correlation coefficient. (K) Effect of HAART on Pyk2Y402* detected on PBMCs obtained from treated patients, as compared with untreated HIV-1–infected donors (mean ± SEM; *, P = 0.0009). (L and M) Effects of P2Y2 knockdown on Pyk2Y402* polarization at the contact site between conjugates during co-culture of HIV Env+ cells and CD4+CXCR4+ cells (L) or co-culture of HIV-1–infected T CEM cells and uninfected P2Y2-depleted T CEM cells (M), as determined by confocal microscopy in three independent experiments (mean ± SEM; *, P < 0.01). (N and O) Effects of Pyk2 depletion on intracellular p24 (N and O) and p24 antigen release (O), as determined by immunofluorescence staining and ELISA, respectively. The indicated parameters were measured after HIVNDK infection of CEM clones transduced with shRNAs specific for Pyk2, 6 d after infection. Representative FACS profiles of three independent experiments are shown in N and quantitative results (mean ± SD; n = 3; *, P < 0.01) are shown in O. (P) Effects of Pyk2 knockdowns on HIVNL43WT infection, hemifusion, and fusion induced by HIV-1 envelope (mean ± SEM; n = 3; *, P < 0.05). The knockdown of Pyk2 by two nonoverlapping siRNAs was confirmed by Western blot (inset).
Figure 7.
Figure 7.
Inhibition of pannexin-1, P2Y2, and Pyk2 reduces HIV-1 infectivity and T cell depletion associated with HIV-1 infection. (A) Effects of pannexin-1, P2Y2, and Pyk2 siRNA on the infectious activity of therapy-resistant HIV-1 mutated viruses (HIVNL43RTK103N and HIVNL43IN140:148). Target cell infectivity was determined using CD4+CXCR4+ cells expressing Tat-inducible β-Gal reporter gene. Results are representative of three independent experiments (mean ± SEM; *, P < 0.01). (B) Effects of different concentrations of suramin, PPADS, and OxATP on HIV mutant infectivity, as determined in A. (C) PH2+IL-2–stimulated PBMCs obtained from HAART-treated patients (with undetectable viremia) were treated with 100 µM suramin, 100 µM PPADS, and 100 µM OxATP. Then, p24 antigen release was determined after 1, 3, and 7 d of infection. Results shown are representative of three HAART-treated patients. (D) HIVNDK-infected PHA+IL-2–stimulated lymphoblasts were treated with 5 µM AMD3100, 100 µM suramin, or 100 µM PPADS. 7-AAD uptake (analyzed by flow cytometry) and intracellular p24 antigen expression (measured by flow cytometry) were assessed. Results were pooled from three independent experiments (mean ± SEM; *, P < 0.01). (E) Involvement of pannexin-1, ATP release, P2Y2 activation, and Pyk2Y402* phosphorylation in early stages of HIV-1 infection. Binding of HIV-1 envelope to cellular receptors leads to rapid ATP release from host cells through pannexin-1. ATP then activates P2Y2 receptors, leading to activation (phosphorylation) of Pyk2 (Pyk2Y402*). P2Y2 and Pyk2 control plasma membrane depolarization, hemifusion, and fusion, which are required for HIV-1 infection.

References

    1. Abbracchio M.P., Boeynaems J.M., Barnard E.A., Boyer J.L., Kennedy C., Miras-Portugal M.T., King B.F., Gachet C., Jacobson K.A., Weisman G.A., Burnstock G. 2003. Characterization of the UDP-glucose receptor (re-named here the P2Y14 receptor) adds diversity to the P2Y receptor family. Trends Pharmacol. Sci. 24:52–55 10.1016/S0165-6147(02)00038-X - DOI - PMC - PubMed
    1. Abbracchio M.P., Burnstock G., Boeynaems J.M., Barnard E.A., Boyer J.L., Kennedy C., Knight G.E., Fumagalli M., Gachet C., Jacobson K.A., Weisman G.A. 2006. International Union of Pharmacology LVIII: update on the P2Y G protein-coupled nucleotide receptors: from molecular mechanisms and pathophysiology to therapy. Pharmacol. Rev. 58:281–341 10.1124/pr.58.3.3 - DOI - PMC - PubMed
    1. Bacheler L.T., Anton E.D., Kudish P., Baker D., Bunville J., Krakowski K., Bolling L., Aujay M., Wang X.V., Ellis D., et al. 2000. Human immunodeficiency virus type 1 mutations selected in patients failing efavirenz combination therapy. Antimicrob. Agents Chemother. 44:2475–2484 10.1128/AAC.44.9.2475-2484.2000 - DOI - PMC - PubMed
    1. Bao L., Locovei S., Dahl G. 2004. Pannexin membrane channels are mechanosensitive conduits for ATP. FEBS Lett. 572:65–68 10.1016/j.febslet.2004.07.009 - DOI - PubMed
    1. Block E.R., Tolino M.A., Klarlund J.K. 2010. Pyk2 activation triggers epidermal growth factor receptor signaling and cell motility after wounding sheets of epithelial cells. J. Biol. Chem. 285:13372–13379 10.1074/jbc.M109.083089 - DOI - PMC - PubMed

Publication types

MeSH terms