. 2012 Apr 5;31(14):1757-70.
doi: 10.1038/onc.2011.365. Epub 2011 Aug 22.

HIF-1-dependent expression of angiopoietin-like 4 and L1CAM mediates vascular metastasis of hypoxic breast cancer cells to the lungs

Affiliations

HIF-1-dependent expression of angiopoietin-like 4 and L1CAM mediates vascular metastasis of hypoxic breast cancer cells to the lungs

H Zhang et al. Oncogene. .

Erratum in

Retraction in

Abstract

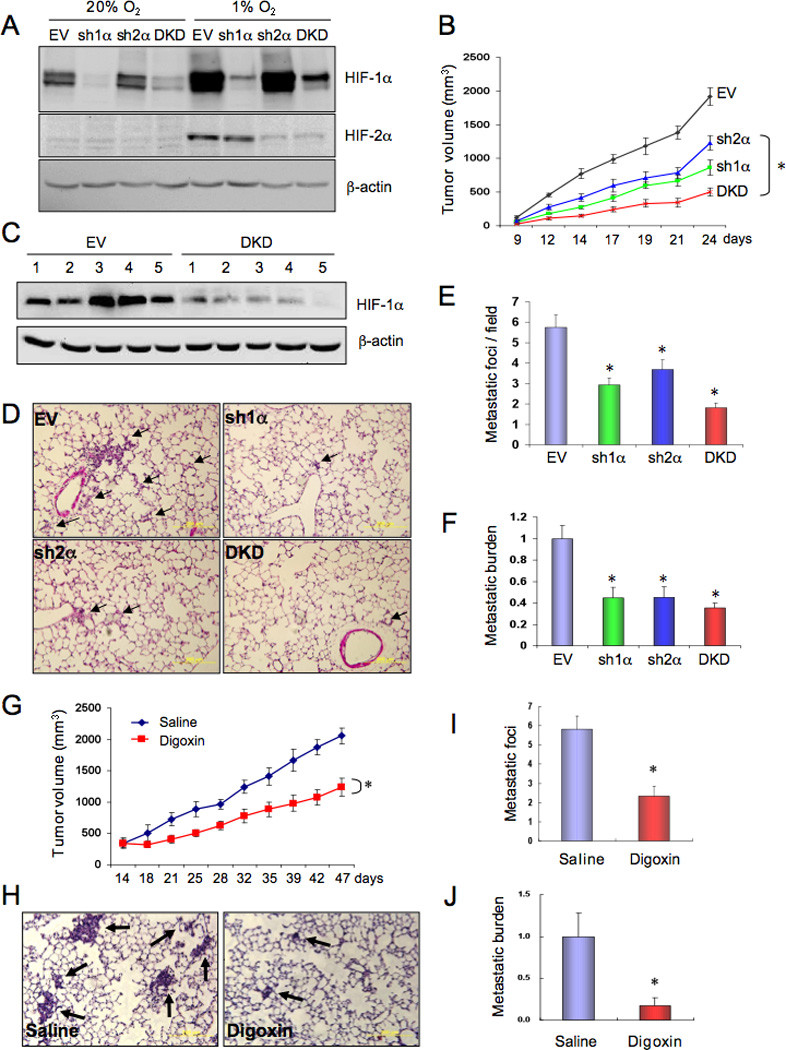
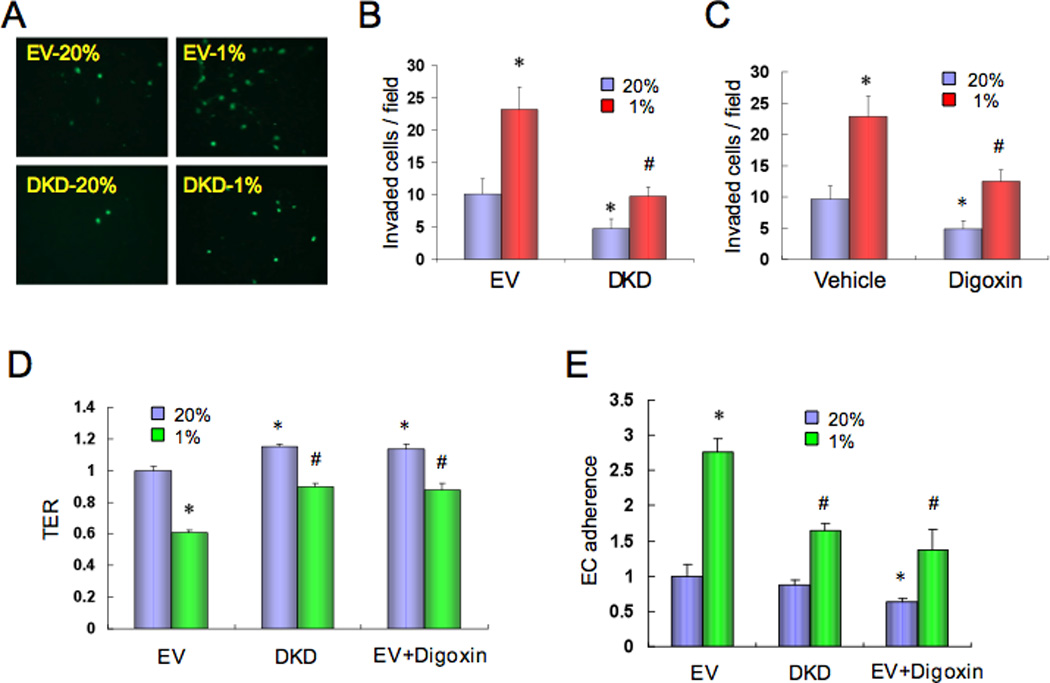
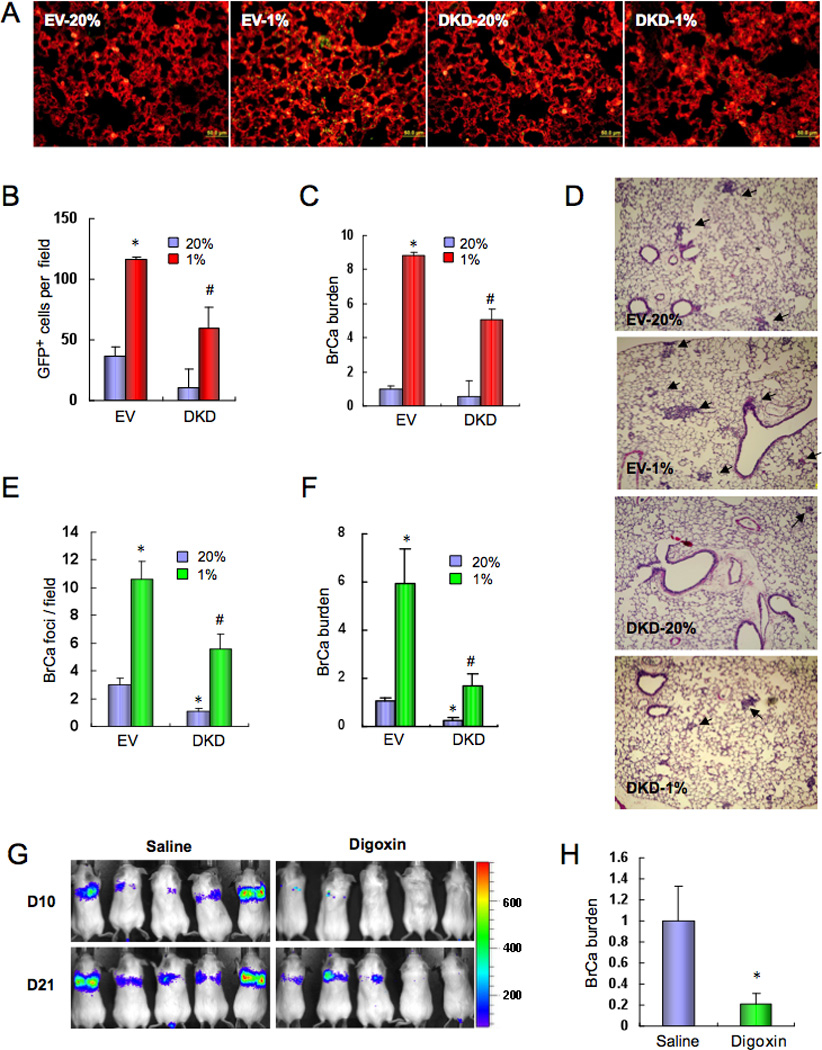
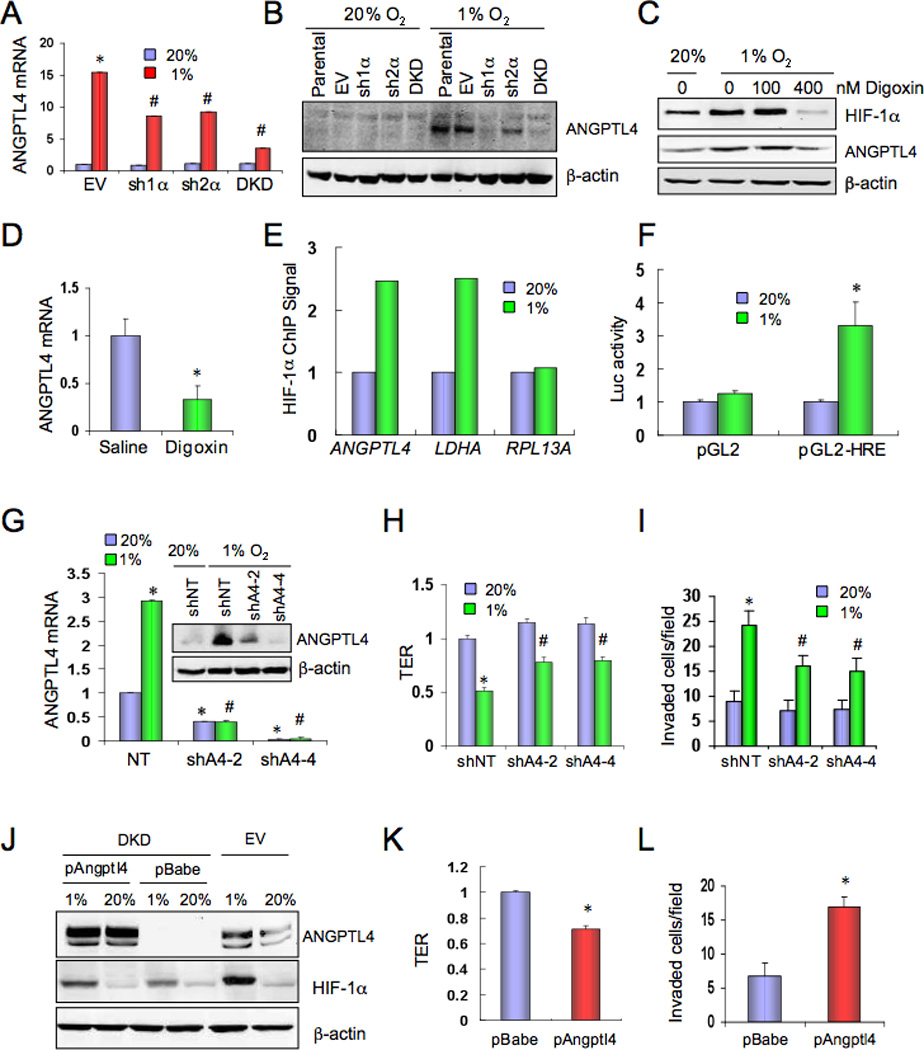
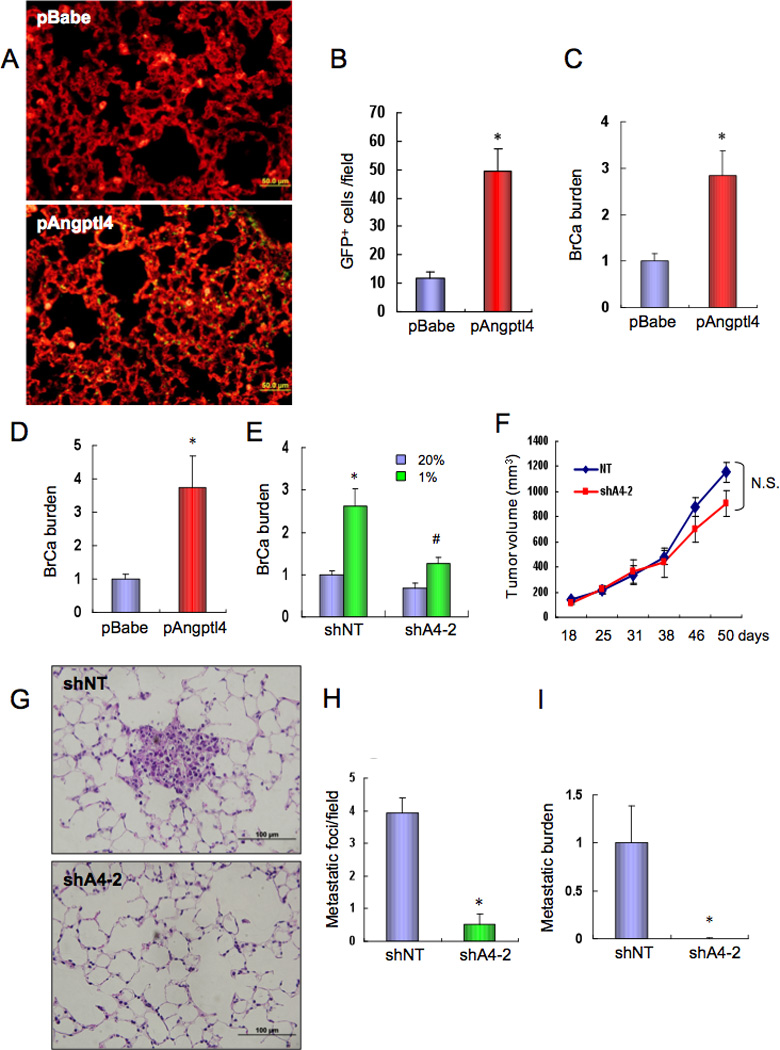
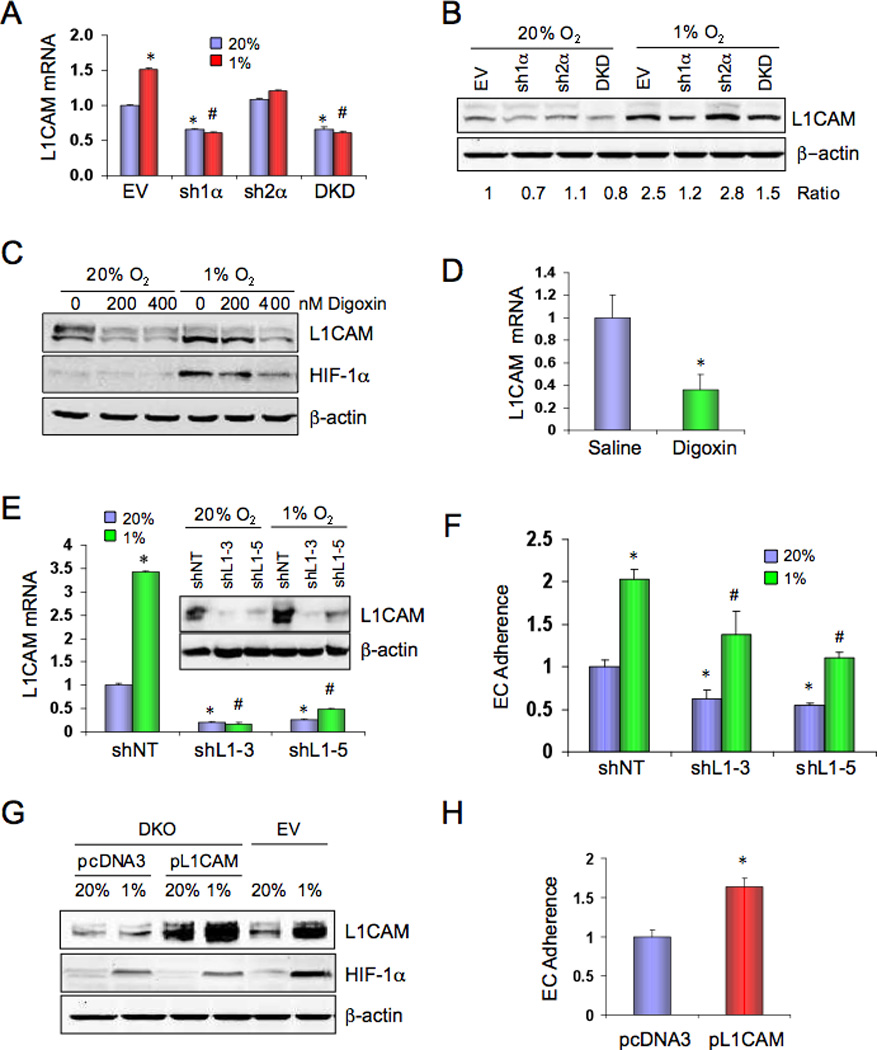
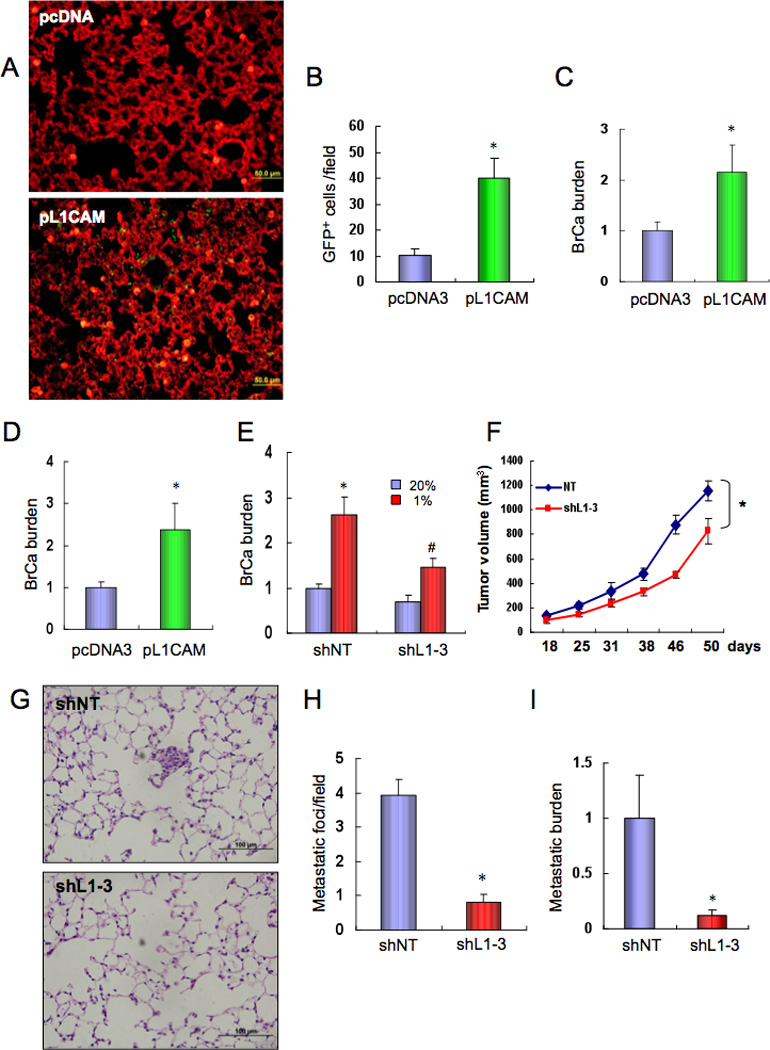
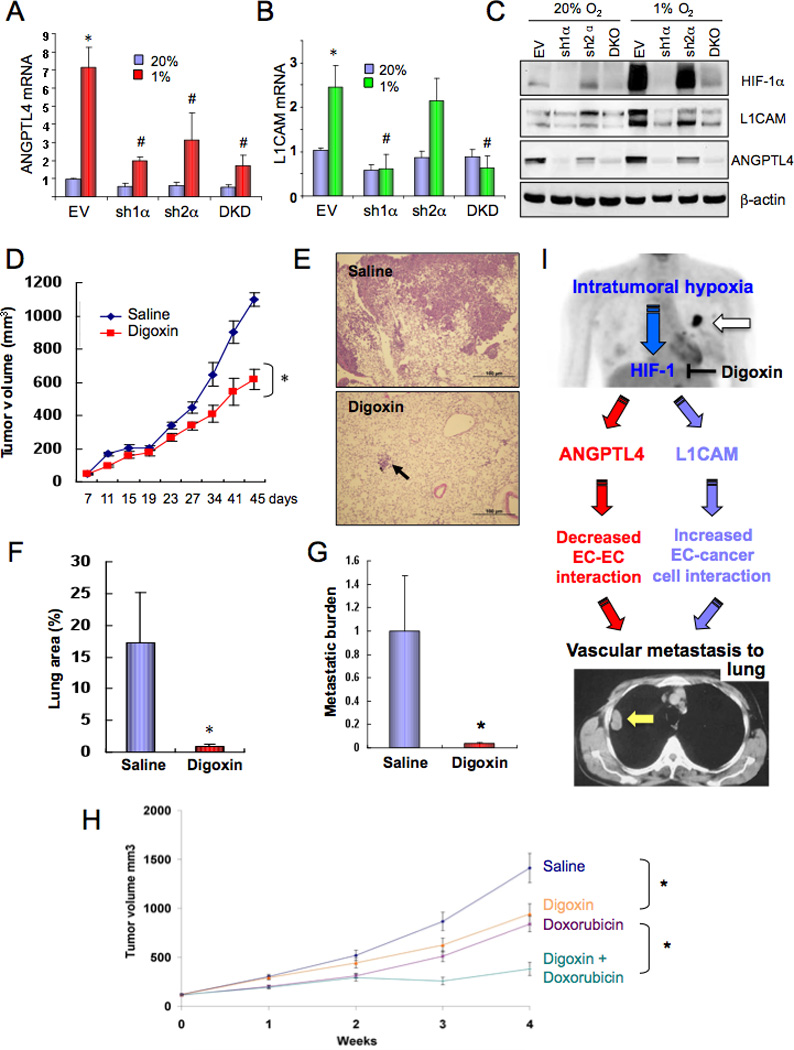
Most cases of breast cancer (BrCa) mortality are due to vascular metastasis. BrCa cells must intravasate through endothelial cells (ECs) to enter a blood vessel in the primary tumor and then adhere to ECs and extravasate at the metastatic site. In this study we demonstrate that inhibition of hypoxia-inducible factor (HIF) activity in BrCa cells by RNA interference or digoxin treatment inhibits primary tumor growth and also inhibits the metastasis of BrCa cells to the lungs by blocking the expression of angiopoietin-like 4 (ANGPTL4) and L1 cell adhesion molecule (L1CAM). ANGPTL4 is a secreted factor that inhibits EC-EC interaction, whereas L1CAM increases the adherence of BrCa cells to ECs. Interference with HIF, ANGPTL4 or L1CAM expression inhibits vascular metastasis of BrCa cells to the lungs.


Conflict of interest statement

Conflict of interest

The authors declare no conflict of interest.

Figures

Figure 1
Figure 1
HIF-1 promotes metastasis of breast cancer to the lungs. (A) MDA-MB-231 cells were stably transfected with a lentiviral vector encoding a short hairpin RNA directed against HIF-1α (sh1α), HIF-2α (sh2α), or both (DKD) or with empty vector (EV). Cells were exposed to 20% or 1% O2 for 4 h and immunoblot assays were performed using whole cell lysates and antibodies against HIF-1α, HIF-2α, or β-actin. (B–F) Each of the MDA-MB-231 subclones was implanted into the mammary fat pad (MFP) of SCID mice (n = 5 mice per subclone). Primary tumor volume (B) was determined from day 9 to day 24 (mean ± SEM; *, P < 0.05 vs EV by two-way ANOVA). On day 24, the primary tumor was harvested for immunoblot assays (C), one lung was fixed, paraffin-embedded sections were stained with hematoxylin-eosin (D), and tumor metastatic foci (arrows) were counted (E). To determine the overall lung metastatic breast cancer cell burden, genomic DNA was purified from the contralateral lung, subjected to quantitative real-time PCR (qPCR) using human-specific primers from the HK2 gene, and the results were normalized to the EV group (F). For E and F, mean ± SEM are shown; *, P < 0.05 vs EV (Student’s t test). (G–J) Parental MDA-MB-231 cells were implanted into the MFP of SCID mice (n = 5 per group), which received daily intraperitoneal (IP) injections of saline or digoxin (2 mg/kg) starting 14 days after implantation. Primary tumor volume (G) was determined every 3–5 days (mean ± SEM; *, P < 0.05 vs Saline; one-way ANOVA). Lung sections were stained with hematoxylin-eosin (H), and metastatic foci (arrows) were counted (I). Total lung DNA was analyzed by qPCR with human-specific primers and the results were normalized to the Saline group (J). For I and J, mean ± SEM are shown; *, P < 0.05 vs Saline (Student’s t test).
Figure 2
Figure 2
HIF-1 modulates interaction of breast cancer cells with endothelium. (A–C) Human umbilical vein endothelial cell (HUVEC) monolayers in a modified Boyden chamber were exposed to CM from (A–B) MDA-MB-231 subclones (EV or DKD) or (C) parental MDA-MB-231 cells (treated with vehicle or 100 nM digoxin) that were cultured at 20% or 1% O2 for 48 h. CMFDA-labeled naive MDA-MB-231 cells were then added and the number of cells that invaded through the HUVEC monolayer was counted under fluorescent microscopy (mean ± SD; n = 9; *, P < 0.05 vs EV-20% (B) or vehicle-20% (C); #, P < 0.05 vs EV-1% (B) or vehicle-1% (C); Student’s t test). (D) HUVEC monolayers were exposed to CM from MDA-MB-231 cells (EV, DKD, or EV treated with 100 nM digoxin) that were cultured at 20% or 1% O2 for 48 h. Trans-endothelial electrical resistance (TER) was measured and normalized to EV-20% (mean ± SD; n = 6; *, P < 0.05 vs EV-20%; #, P < 0.05 vs EV-1%; Student’s t test). (E) MDA-MB-231 cells (EV or DKD) were cultured at 20% or 1% O2 for 48 h in the presence (EV+Digoxin) or absence (EV and DKD) of 100 nM digoxin, labeled with CMFDA, and their adhesion to HUVEC monolayers was determined (mean ± SD; n = 3; *, P < 0.05 vs EV-20%; #, P < 0.05 vs EV-1%; Student’s t test).
Figure 3
Figure 3
HIF-1 promotes the extravasation of breast cancer cells. (A–C) GFP-expressing MDA-MB-231 cells (EV or DKD) were cultured at 20% or 1% O2 for 48 h and then injected into the tail vein of SCID mice. After 1 week, the mice were sacrificed and lung sections were stained with fluorescently-labeled isolectin B4 (A). Extravasated GFP-expressing cancer cells (yellow) in isolectin B4-stained lung tissues (red) were counted (B). To quantify the lung breast cancer (BrCa) cell burden, total lung DNA was analyzed by qPCR with human-specific primers and the results were normalized to EV-20% (C). In B and C, mean ± SEM are shown (n = 5); *, P < 0.05 vs EV-20%; #, P < 0.05 vs EV-1%; Student’s t test. (D–F) MDA-MB-231 cells (EV or DKD) were cultured at 20% or 1% O2 for 48 h and then injected into the tail vein of SCID mice. 3 weeks later, lungs were harvested, sections stained with hematoxylin-eosin (D), and tumor metastatic foci (arrows) were counted (E). To determine the lung BrCa cell burden, total lung DNA was analyzed by qPCR with human-specific primers and the results were normalized to EV-20% (F). In E and F, mean ± SEM (n = 4–5) are shown; *, P < 0.05 vs EV-20%; #, P < 0.05 vs EV-1% (Student’s t test). (G–H) MDA-MB-231 cells stably expressing firefly luciferase were injected into the tail vein of SCID mice, which were then treated with daily IP injections of saline or digoxin (2 mg/kg). Bioluminescent imaging was performed on days 10 and 21 after injection (G). On day 21, lung DNA was analyzed by qPCR with human-specific primers and the results (BrCa burden; mean ± SEM, n = 5) were normalized to Saline (H). *, P < 0.05 vs Saline (Student’s t test).
Figure 4
Figure 4
ANGPTL4 expression is regulated by HIF-1 and inhibits EC-EC interaction. (A) MDA-MB-231 subclones were cultured at 20% or 1% O2 for 24 h. ANGPTL4 mRNA expression was determined by reverse-transcription (RT) qPCR, relative to EV-20% (mean ± SD, n = 3); *, P <0.05 vs EV-20%; #, P < 0.05 vs EV-1%; Student’s t test. (B) MDA-MB-231 subclones were cultured at 20% or 1% O2 for 48 h. ANGPTL4 and β–actin protein expression was determined by immunoblot assay. (C) Parental MDA-MB-231 cells were cultured at 20% or 1% O2 for 48 h in the presence of the indicated concentration of digoxin. HIF-1α, ANGPTL4, and β–actin protein levels were determined by immunoblot assay. (D) ANGPTL4 mRNA expression in primary tumors from saline or digoxin-treated mice (shown in Figure 1G) was determined by RT-qPCR (mean ± SD; n = 5; *, P < 0.05; Student’s t test). (E) Cells were cultured at 20% or 1% O2 and chromatin immunoprecipitation (ChIP) was performed using anti-HIF-1α or control IgG followed by qPCR using ANGPTL4, LDHA, and RPL13A primers. The ratio of qPCR signals derived from anti-HIF-1α:IgG ChIP and normalized to the 20% O2 condition is shown. (F) A 56-bp nucleotide sequence, which encompasses the HIF-1 binding site in the ANGPTL4 gene identified by ChIP, was inserted into the firefly luciferase vector pGL2-Promoter (pGL2-HRE). Cells were co-transfected with pSV-Renilla and pGL2-HRE or empty vector (pGL2), cultured at 20% or 1% O2 for 24 h, and the ratio of firefly:Renilla luciferase was determined (mean ± SEM; *P < 0.05 vs pGL2-1% or pGL2-HRE-20%). (G–I) MDA-MB-231 cells stably expressing a non-targeting shRNA (shNT) or either of two independent shRNAs targeting ANGPTL4 (shA4-2, shA4-4) were cultured at 20% or 1% O2 and analyzed for: (G) ANGPTL4 mRNA (RT-qPCR; n = 3) and protein (inset) levels; (H) effect of CM on transendothelial resistance (TER; n = 6); and (I) invasion through HUVEC monolayer (n = 9). Data shown are mean ± SD; *, P < 0.05 vs shNT-20%; #, P < 0.05 vs shNT-1% (Student’s t test). (J–L) MDA-MB-231 DKD cells stably transfected with empty expression vector (pBabe) or vector encoding ANGPTL4 (pAngptl4) were cultured at 20% or 1% O2 for 48 h and analyzed for: (J) ANGPTL4, HIF-1α, and β–actin protein expression; and effect of CM on (K) TER (n = 6) and (L) invasion through HUVEC monolayer (n = 9). Data shown are mean ± SD; *, P < 0.05 (Student’s t test).
Figure 5
Figure 5
ANGPTL4 enhances breast cancer cell metastasis to the lungs. (A–C) pBabe and pAngptl4 subclones of MDA-MB-231 DKD cells were injected into the tail vein of SCID mice. After 1 week, lung tissues were harvested, sections stained with isolectin B4, and GFP-expressing cancer cells (A) were counted under fluorescent microscopy (B). To determine the lung BrCa burden, lung DNA was analyzed by qPCR with GFP primers and the results (mean ± SEM, n = 5) were normalized to pBabe (C). *, P < 0.05 (Student’s t test). (D) pBabe and pAngptl4 subclones were injected into the tail vein of SCID mice. After 3 weeks, lung DNA was analyzed by qPCR with GFP primers and results (BrCa burden; mean ± SEM, n = 5) were normalized to pBabe. *, P < 0.05 (Student’s t test). (E) MDA-MB-231 cells stably expressing shNT or shA4-2 were cultured at 20% or 1% O2 for 48 h and injected into the tail vein of SCID mice. After 3 weeks, lung DNA was analyzed by qPCR with HK2 primers and results (mean ± SEM, n = 5) were normalized to shNT-20%. *, P < 0.05 vs shNT-20%; #, P < 0.05 vs shNT-1% (Student’s t test). (F–I) MDA-MB-231 cells stably expressing shA4-2 or shNT were implanted in the MFP of SCID mice. Primary tumor volume (F) was determined every 3–5 days; N.S., not significant (ANOVA). Lung sections were stained with hematoxylin-eosin (G) and metastatic foci were counted (H). Lung DNA was subjected to qPCR with human specific HK2 primers (I). Mean ± SEM data are shown (n = 5); *, P<0.05 vs shNT (Student’s t test).
Figure 6
Figure 6
L1CAM is regulated by HIF-1 and stimulates EC-cancer cell interaction. (A) MDA-MB-231 subclones were cultured at 20% or 1% O2 for 24 h and L1CAM mRNA was analyzed by RT-qPCR (mean ± SD, n = 3). *, P < 0.05 vs EV-20%; #, P < 0.05 vs EV-1%; Student’s t test. (B) MDA-MB-231 subclones were cultured at 20% or 1% O2 for 48 h and L1CAM and β-actin protein levels were determined by immunoblot assay. The ratio of L1CAM:β-actin signal intensity, normalized to EV-20%, is shown. (C) Parental MDA-MB-231 cells were cultured at 20% or 1% O2 for 48 h in the presence of the indicated concentration of digoxin and cell lysates were subjected to immunoblot assays. (D) L1CAM mRNA expression in primary tumors (from Figure 1G) was analyzed by RT-qPCR (mean ± SD; n = 5; *, P < 0.05 vs Saline). (E–F) MDA-MB-231 cells stably expressing a non-targeting shRNA (shNT) or either of two independent shRNAs targeting L1CAM (shL1-3, shL1-5) were cultured at 20% or 1% O2 and analyzed for: (E) L1CAM mRNA and protein (inset) expression; and (F) adherence to HUVEC monolayer (mean ± SD; n = 3; *, P < 0.05 vs shNT-20%; #, P < 0.05 vs NT-1%; Student’s t test). (G–H) MDA-MB-231 EV cells and DKD cells stably transfected with empty vector (pcDNA3) or vector encoding L1CAM (pL1CAM) were cultured at 20% or 1% O2 for 48 h and analyzed for: (G) L1CAM, HIF-1α, and β–actin protein expression; and (H) adherence to HUVEC monolayer (mean ± SD; n = 3; *, P < 0.05 vs pcDNA3; Student’s t test).
Figure 7
Figure 7
L1CAM promotes breast cancer cell metastasis to the lungs. (A–C) MDA-MB-231 DKD cells stably transfected with pcDNA3 or pL1CAM were injected into the tail vein of SCID mice. After 1 week, lung tissues were harvested, sections stained with isolectin B4, and GFP-expressing cancer cells (A) were counted under fluorescent microscopy (B). To determine the lung BrCa burden, lung DNA was analyzed by qPCR with GFP primers and the results (mean ± SEM, n = 5) were normalized to pcDNA3 (C). *, P < 0.05 (Student’s t test). (D) pcDNA3 and pL1CAM subclones of MDA-MB-231 DKD cells were injected into the tail vein of SCID mice. After 3 weeks, lung DNA was analyzed by qPCR with GFP primers and results (BrCa burden; mean ± SEM, n = 5) were normalized to pcDNA3. *, P < 0.05 (Student’s t test). (E) MDA-MB-231 cells stably expressing shNT or shL1-3 were cultured at 20% or 1% O2 for 48 h and injected into the tail vein of SCID mice. After 3 week, lung DNA was analyzed by qPCR with HK2 primers and results (mean ± SEM, n = 5) were normalized to shNT-20%. *, P < 0.05 vs shNT-20%; #, P < 0.05 vs shNT-1% (Student’s t test). (F–I) MDA-MB-231 cells stably expressing shL1-3 or shNT were implanted in the MFP of SCID mice. Primary tumor volume (F) was determined every 3–5 days (mean ± SEM; *, P < 0.05; ANOVA). Lung sections were stained with hematoxylin-eosin (G), and metastatic foci were counted (H). Lung DNA was used to quantify metastatic burden by qPCR with human HK2 primers (I). Mean ± SEM (n = 5); *, P<0.05 vs shNT (Student’s t test).
Figure 8
Figure 8
HIF-1 regulates ANGPTL4 and L1CAM expression and promotes metastasis of MDA-MB-435 cells to the lungs. (A–C) MDA-MB-435 cells stably transfected with a lentiviral vector encoding short hairpin RNA directed against HIF-1α (sh1α), HIF-2α (sh2α), or both (DKD) or with empty vector (EV) were cultured at 20% or 1% O2 for 24 (A–B) or 48 (C) h. ANGPTL4 (A) and L1CAM (B) mRNA expression was determined by RT-qPCR, relative to EV-20% (mean ± SD, n = 3); *, P <0.05 vs EV-20%; #, P < 0.05 vs EV-1% (Student’s t test). Protein expression was determined by immunoblot assay (C). (D–G) MDA-MB-435 cells were implanted in the MFP of SCID mice (n = 5 each), which were treated with daily IP injections of saline or digoxin (2 mg/kg) starting 7 days after implantation. Tumor volumes were determined every 3–5 days (D). *, P < 0.05 vs Saline (ANOVA). Lung sections were stained with hematoxylin-eosin (E) and the percentage of total lung area occupied by metastases was determined (F). Lung DNA was analyzed by qPCR with HK2 primers and results (mean ± SEM, n = 5) were normalized to Saline (G). *, P < 0.05 vs Saline (Student’s t test). (H) Effect of combined therapy with digoxin and doxorubicin. Mice bearing MDA-MB-231 xenografts were treated, starting at time 0 with daily digoxin (1 mg/kg IP) or weekly doxorubicin (2 mg/kg IV) injections or both. Tumor volume was determined weekly (mean ± SEM, n = 8). *P < 0.05 (ANOVA) for indicated comparison. (I) Role of HIF-1-dependent ANGPTL4 and L1CAM expression in vascular metastasis of hypoxic BrCa cells to the lungs. Primary BrCa and lung metastasis are indicated by white and yellow arrows, in top and bottom panel, respectively.

Similar articles

Cited by

References

    1. Belanger AJ, Lu H, Date T, Liu LX, Vincent KA, Akita GY, et al. Hypoxia up-regulates expression of peroxisome proliferator-activated receptor gamma angiopoietin-related gene (PGAR) in cardiomyocytes: role of hypoxia inducible factor 1α. J Mol Cell Cardiol. 2002;34:765–774. - PubMed
    1. Bos R, van der Groep P, Greijer AE, Shvarts A, Meijer S, Pinedo HM, et al. Levels of hypoxia-inducible factor 1α independently predict prognosis in patients with lymph node negative breast carcinoma. Cancer. 2003;97:1573–1581. - PubMed
    1. Bos R, Zhong H, Hanrahan CF, Mommers EC, Semenza GL, Pinedo HM, et al. Levels of hypoxia-inducible factor 1α during breast carcinogenesis. J Natl Cancer Inst. 2001;93:309–314. - PubMed
    1. Buffa FM, Harris AL, West CM, Miller CJ. Large meta-analysis of multiple cancers reveals a common, compact and highly prognostic hypoxia metagene. Br J Cancer. 2010;102:428–435. - PMC - PubMed
    1. Cailleau R, Young R, Olivé M, Reeves WJ., Jr. Breast tumor cell lines from pleural effusions. J Natl Cancer Inst. 1978;53:661–674. - PMC - PubMed

Publication types

Substances