. 2012 Mar 22;31(12):1599-608.
doi: 10.1038/onc.2011.350. Epub 2011 Aug 22.

Cellular features of senescence during the evolution of human and murine ductal pancreatic cancer

Affiliations

Cellular features of senescence during the evolution of human and murine ductal pancreatic cancer

M E Caldwell et al. Oncogene. .

Abstract

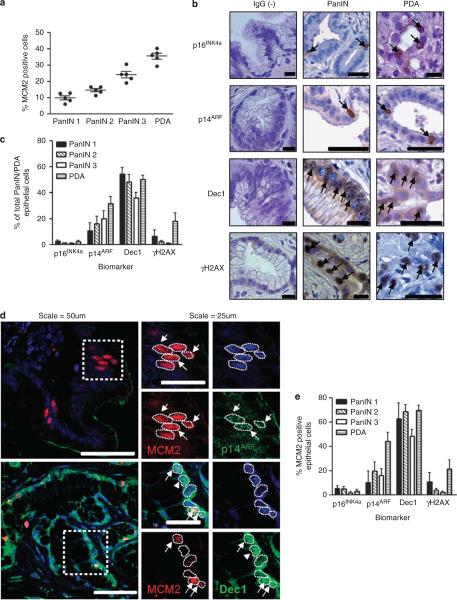
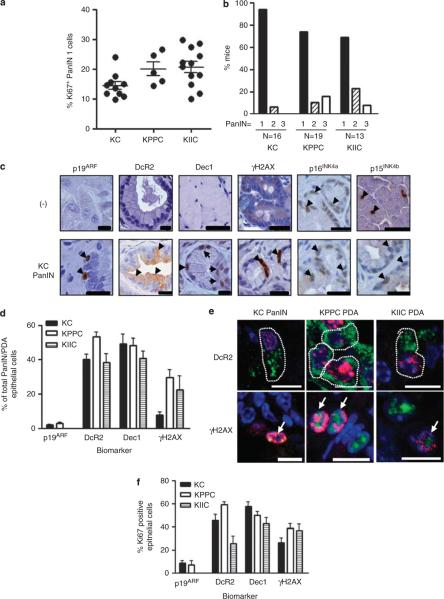
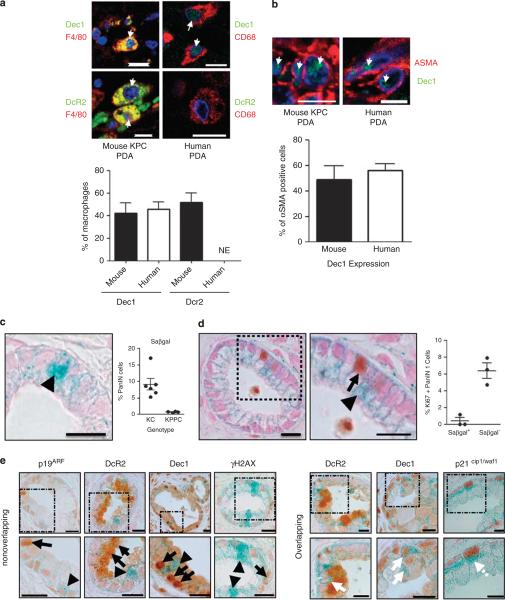
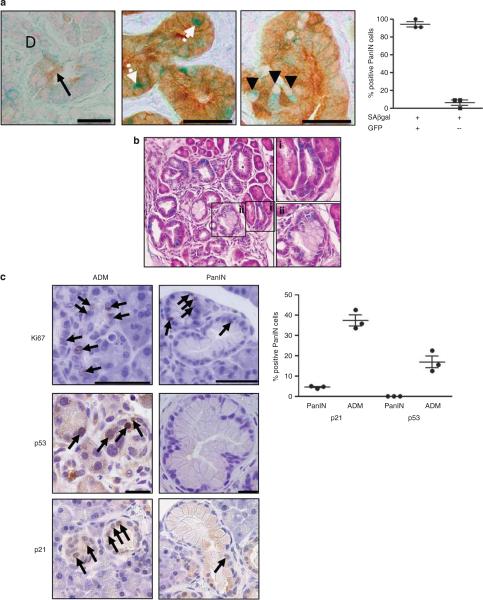
During tumor initiation, oncogene-induced senescence (OIS) is proposed to limit the progression of preneoplasms to invasive carcinoma unless circumvented by the acquisition of certain tumor suppressor mutations. Using a variety of biomarkers, OIS has been previously reported in a wide range of human and murine precursor lesions, including the pancreas, lung, colon and skin. Here, we have characterized a panel of potential OIS biomarkers in human and murine pancreatic intraepithelial neoplasia (PanIN), and found that only senescence-associated β-galactosidase (SAβgal) activity is specifically enriched in these precursors, compared with pancreatic ductal adenocarcinoma (PDA). Indeed, many of the other proposed OIS biomarkers are detected in actively proliferating PanIN epithelium and in cells within the microenvironment. Surprisingly, acinar to ductal metaplasia (ADM), a distinct preneoplasm that is potentially a precursor for PanIN, also exhibits SAβgal activity and contains a higher content of p21 and p53 than PanIN. Therefore, SAβgal activity is the only biomarker that accurately identifies a small and heterogeneous population of non-proliferating premalignant cells in the pancreas, and the concomitant expression of p53 and p21 in ADM supports the possibility that PanIN and ADM each exhibit discrete senescence blocks.


Figures

Figure 1
Figure 1
Absence of enrichment of putative OIS biomarkers in hPanIN and presence of markers in dividing cells. Formalin-fixed paraffin-embedded human pancreatic PanIN and PDA samples were acquired from Addenbrookes' Teaching Hospitals NHS Trust, Cambridge, UK, or from the Department of Pathology, Johns Hopkins University School of Medicine in Baltimore, MD, USA. Ethical approval was granted by the local research and ethics committee (LREC Number: 08/H0306/32). (a) Proliferation content of hPanIN and PDA by using marker MCM2; each data point represents the average of at least four fields from the human sample (N = 5). (b) p16INK4a, p19ARF, Dec1 and γH2AX are present and measurable in hPanIN and PDA. Species-specific IgG was used as a negative control (left column). Arrows denote biomarker positive cells. After heat-induced antigen retrieval for 12.5 min in 0.01 m sodium citrate, immunohistochemistry was performed using antibodies at dilution denoted in Table 1. Primary antibodies were incubated overnight and species-specific biotinylated secondary antibodies followed by streptatvidin-peroxidase conjugate, developed with DAB and counterstained with hematoxylin. Scale = 200 μm. (c) Quantification of putative OIS biomarker abundance in hPanIN and PDA. Each bar represents at least four hPanIN or PDA samples. (d) Coimmunofluorescence experiments for potential OIS biomarker (green) and proliferating antigen MCM2 (red) demonstrate colocalization of these two biomarkers in PanIN. Nuclei outlined by white dotted line. OIS/MCM2 double-positive cells are denoted by white arrows. OIS biomarker positive only cells are denoted by white arrowheads. After heat-mediated antigen retrieval in 0.01 m sodium citrate for 12.5 min and blocking in donkey serum for 30 min, primary OIS biomarker and proliferation biomarker were applied together overnight. The next day, secondary antibodies conjugated to the appropriate fluorophore were applied for 30 min at 37 °C, followed by two washes in phosphate-buffered saline and mounting in Prolong Gold antifade reagent containing 4,6-diamidino-2-phenylindole (Invitrogen, Carlsbad, CA, USA). Scale = 200 μm. (e) Quantification of OIS biomarker expression in proliferating cells. Each bar represents at least four hPanIN or PDA samples. Error bars indicate s.e.m.
Figure 2
Figure 2
Putative OIS biomarker expression is unchanged in mPanIN, conditionally mutant for p53 or Cdkn2a. All animals were housed in accordance with the UK Home Office, within the designated vivarium at the Cancer Research UK Cancer Research Institute. Pancreatic-specific expression of a conditional point-mutated allele of Kras (LSL-KrasG12D) elicits mPanIN and PDA that exhibit pathology, consistent with the human condition (Hingorani et al., 2003). Acceleration of tumor development was accomplished by interbreeding these KrasG12D;Cre (KC) mice with mice harboring a conditional floxed allele of Trp53 or Ink4A/ARF to generate the KrasG12D;p53flox/flox;Cre (KPPC) or KrasG12D;Ink4A/ARFflox/flox;Cre (KIIC) strains, respectively. Rosa26-RYFP allele (Srinivas et al., 2001) was bred to KC mice to label cre-mediated recombination in the pancreas. Archival formalin-fixed paraffin-embedded KC, KPPC and KIIC pancreata were sectioned for immunohistochemical analyses. (a) Proliferation of KC, KPPC and KIIC PanIN samples. Each data point represents the average of at least five fields from a single mouse. Statistical analyses were carried out using Graphpad Prism version 5.0 (GraphPad Software, San Diego, CA, USA). Mann–Whitney U-test was used to determine significance: KC versus KPPC, P = 0.0400; KC versus KIIC, P = 0.0029. (b) KPPC and KIIC mice harbor more high-grade PanIN, compared with KC mice. (c) Immunohistochemical analysis of potential OIS biomarker expression in mouse. Knockout mouse tissue was used as a negative control to evaluate the specificity of all markers, except DcR2. DcR2 negative control is species-specific IgG (top row). Arrowheads denote positive cells. Scale = 200 μm. (d) Quantification of potential OIS biomarker expression in murine KC PanIN, and KPPC and KIIC PDA. At least three representative images from each mouse were quantified, the average of which represents a single data point. (e) Immunofluorescent detection reveals that Dec1, DcR2, γH2AX and p19ARF (green) can be colocalized in Ki67 (red)-positive epithelial cells in mPanIN and PDA. Scale = 10 μm. White arrows denote double positive cells. (f) Quantification of coimmunofluorescent staining indicates that a significant fraction of Ki67-positive cells harbor putative OIS biomarkers. Error bars indicate s.e.m. (N = at least 4). At least three representative images from each mouse were quantified, the average of which represents a single data point.
Figure 3
Figure 3
SAβgal labels a small population of growth-arrested PanIN cells. After heat-mediated antigen retrieval in 0.01 m sodium citrate for 12.5 min and blocking in donkey serum for 30 min, two primary antibodies were applied together overnight. The next day, secondary antibodies conjugated to the appropriate fluorophore were applied for 30 min at 37 °C, followed by two washes in phosphate-buffered saline (PBS) and mounting in Prolong Gold antifade reagent containing 4,6-diamidino-2-phenylindole. (a) Dec1 (green) is found in a significant fraction of murine and human tumor-associated macrophages. DcR2 (green) is found in murine, but not human tumor-associated macrophages. NE, not expressed (human N=5, mouse N=4). Arrows denote double positive cells. (b) Coimmunofluorescence for Dec1 (green) and αSMA (red) shows Dec1 is expressed in cancer-associated fibroblasts. Quantification is shown below. Scale=10 μm. Error bar indicates s.e.m. (c) Freshly dissected pancreas was cut into 1-3 mm pieces and fixed in 4% paraformaldehyde (PFA) (pH 6.0) for 2 h on ice. Samples were washed with PBS and tissue was incubated overnight in SAβgal staining solution at 37 °C. The following day, the samples were washed with PBS then fixed in 10% formalin overnight. The next day the tissues were washed with PBS and processed using reduced xylene exposure times. 4 μm sections were cut, counterstained with nuclear fast red (Sigma, St Louis, MO, USA) and coverslipped for immediate imaging or first subjected to immunohistochemistry. Representative image of SAβgal stain (left). Arrowhead denotes Saβgal-positive cell. SAβgal expression in KC PanIN and conditional biallelic deletion of Trp53 rescues the majority of PanIN SAβgal content (right). Each dot represents the average of at least five images for a single mouse of the indicated genotype. (d) Slides were dewaxed in xylenes (1 min shaking) and rehydrated in 100% ethanol (40 s shaking) and 70% ethanol (20 s shaking). Antigen unmasking was performed in 10 mm sodium citrate buffer, pH 6.0. Immunohistochemistry was performed as described above with the exception that slides were counterstained for 10 s with nuclear fast red (Sigma). Ki67 immunohistochemistry overlaid on SAβgal stained KC PanIN tissue reveals a mutually exclusive staining pattern (inset at right). Arrowhead denotes SAβgal positive cells. Arrow denotes Ki67 positive cell. Scale 200 μm. Quantification demonstrating SAβgal is largely excluded from Ki67-positive cells at the right. (e) Additional putative OIS biomarkers are not enriched in SAβgal expressing PanIN cells. Arrows denote OIS-associated biomarker-positive cells. Arrowheads denote SAβgal-positive cells. White arrows denote OIS/SAβgal double-positive cells. Scale=200 μm.
Figure 4
Figure 4
ADM exhibits additional senescence block by SAβgal, p21 and p53 expression. (a) Green fluorescent protein (GFP) immunohistochemistry overlaid on SAβgal stained PanIN tissue. Left panel demonstrates background from GFP antibody in acinar (black arrow), but not ductal tissues (labeled D) from a mouse lacking the GFP reporter. White arrows denote GFP/SAβgal-positive cells; arrowheads denote GFP-negative/SAβgal-positive cells. Quantification of cells expressing SAβgal and GFP reveals a small population of GFP-negative PanIN cells shown at right. (b) Hematoxylin and eosin counterstain over SAβgal stained KC pancreata. SAβgal is comparably detected in both (i) ADM and (ii) PanIN. (c) Ki67, p53 and p21 immunohistochemical detection in ADM and PanIN from KC mice. Arrows denote single-positive cells. Quantification of p21 and p53 positivity in PanIN and ADM regions, respectively, shown at right (N=3).

References

    1. Acosta JC, O'Loghlen A, Banito A, Guijarro MV, Augert A, Raguz S, et al. Chemokine signaling via the CXCR2 receptor reinforces senescence. Cell. 2008;133:1006–1018. - PubMed
    1. Bartkova J, Rezaei N, Liontos M, Karakaidos P, Kletsas D, Issaeva N, et al. Oncogene-induced senescence is part of the tumorigenesis barrier imposed by DNA damage checkpoints. Nature. 2006;444:633–637. - PubMed
    1. Braig M, Lee S, Loddenkemper C, Rudolph C, Peters AH, Schlegelberger B, et al. Oncogene-induced senescence as an initial barrier in lymphoma development. Nature. 2005;436:660–665. - PubMed
    1. Campisi J, d'Adda di Fagagna F. Cellular senescence: when bad things happen to good cells. Nat Rev Mol Cell Biol. 2007;8:729–740. - PubMed
    1. Chien Y, Lowe SW. Secreting tumor suppression. Cell. 2008;132:339–341. - PMC - PubMed

Publication types