

Pim1 kinase is required to maintain tumorigenicity in MYC-expressing prostate cancer cells
- PMID: 21860423
- PMCID: PMC3223544
- DOI: 10.1038/onc.2011.371
Pim1 kinase is required to maintain tumorigenicity in MYC-expressing prostate cancer cells
Abstract
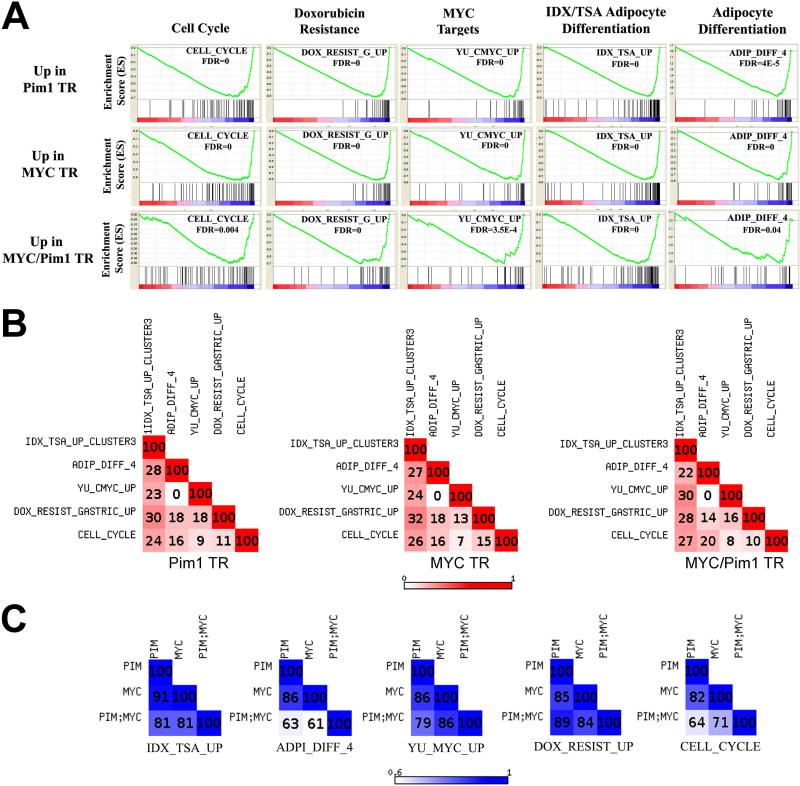
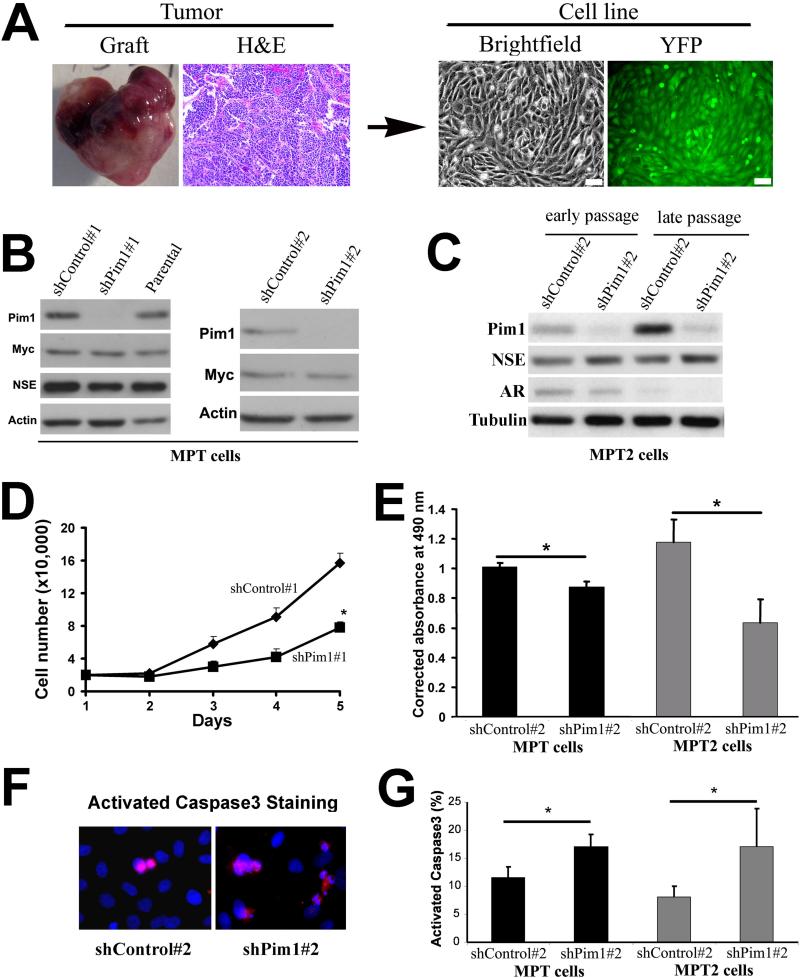
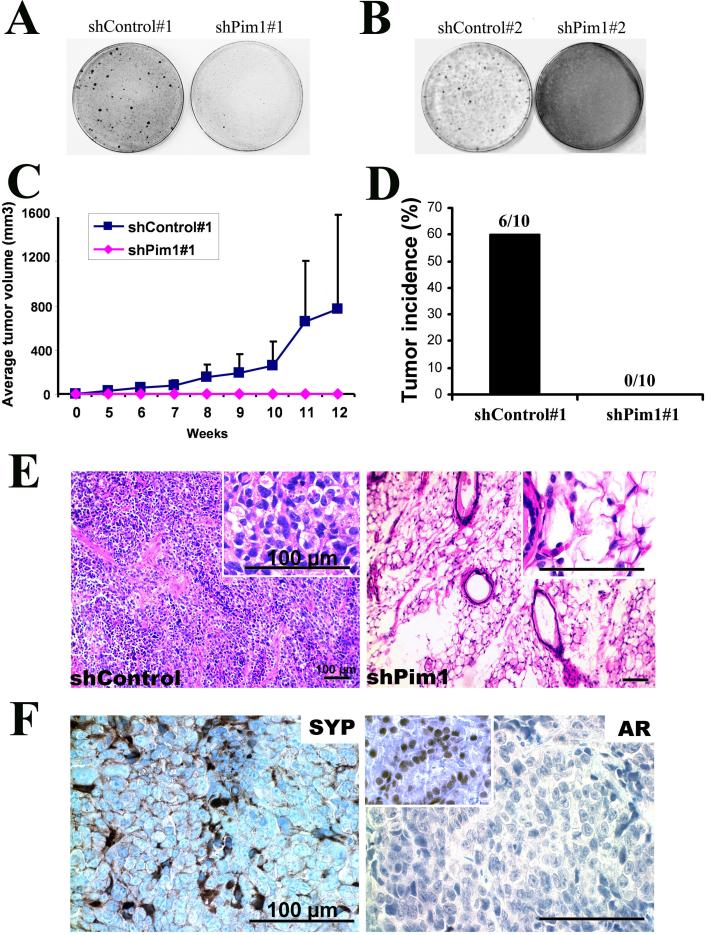
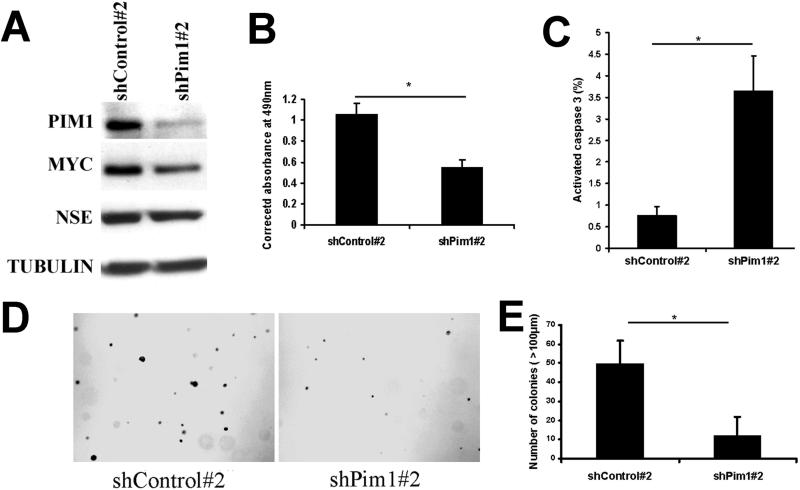
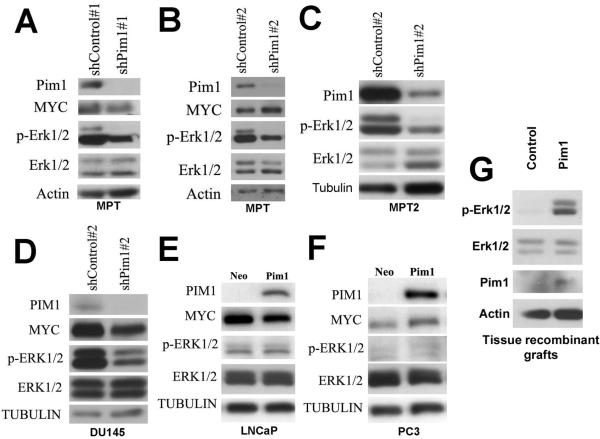
PIM1 kinase and MYC are commonly co-expressed in human prostate cancer and synergize to induce rapidly progressing prostate cancer in mouse models. Deficiency of the Pim kinase genes is well tolerated in vivo, suggesting that PIM1 inhibition might offer an attractive therapeutic modality for prostate cancer, particularly for MYC-expressing tumors. Here we examine the molecular consequences of Pim1 and MYC overexpression in the prostate as well as the effects of depleting Pim1 in prostate carcinoma cells with high levels of MYC. Overexpression of Pim1 in the mouse prostate induces several pro-tumorigenic genetic programs including cell cycle genes and Myc-regulated genes before the induction of any discernible pathology. Pim1 depletion by RNA interference in mouse and human prostate cancer cells decreased cellular proliferation, survival, Erk signaling and tumorigenicity even when MYC levels were not significantly altered. These results indicate that PIM1 may be necessary to maintain tumorigenicity, and further support efforts aimed at developing PIM1 inhibitors for prostate cancer therapy.
Figures
Similar articles
-
Pim1 promotes human prostate cancer cell tumorigenicity and c-MYC transcriptional activity.BMC Cancer. 2010 Jun 1;10:248. doi: 10.1186/1471-2407-10-248. BMC Cancer. 2010. PMID: 20515470 Free PMC article.
-
Pim1 kinase synergizes with c-MYC to induce advanced prostate carcinoma.Oncogene. 2010 Apr 29;29(17):2477-87. doi: 10.1038/onc.2010.10. Epub 2010 Feb 8. Oncogene. 2010. PMID: 20140016 Free PMC article.
-
RNAi screen identifies a synthetic lethal interaction between PIM1 overexpression and PLK1 inhibition.Clin Cancer Res. 2014 Jun 15;20(12):3211-21. doi: 10.1158/1078-0432.CCR-13-3116. Epub 2014 Apr 25. Clin Cancer Res. 2014. PMID: 24771642 Free PMC article.
-
PIM1 kinase as a target in prostate cancer: roles in tumorigenesis, castration resistance, and docetaxel resistance.Curr Cancer Drug Targets. 2014;14(2):105-14. doi: 10.2174/1568009613666131126113854. Curr Cancer Drug Targets. 2014. PMID: 24274399 Review.
-
Potential roles for the PIM1 kinase in human cancer - a molecular and therapeutic appraisal.Eur J Cancer. 2008 Oct;44(15):2144-51. doi: 10.1016/j.ejca.2008.06.044. Epub 2008 Aug 18. Eur J Cancer. 2008. PMID: 18715779 Review.
Cited by
-
PIM kinases mediate resistance of glioblastoma cells to TRAIL by a p62/SQSTM1-dependent mechanism.Cell Death Dis. 2019 Jan 18;10(2):51. doi: 10.1038/s41419-018-1293-3. Cell Death Dis. 2019. PMID: 30718520 Free PMC article.
-
The PIM family of oncoproteins: small kinases with huge implications in myeloid leukemogenesis and as therapeutic targets.Oncotarget. 2014 Sep 30;5(18):8503-14. doi: 10.18632/oncotarget.2330. Oncotarget. 2014. PMID: 25238262 Free PMC article.
-
Nkx3.1 and Myc crossregulate shared target genes in mouse and human prostate tumorigenesis.J Clin Invest. 2012 May;122(5):1907-19. doi: 10.1172/JCI58540. Epub 2012 Apr 9. J Clin Invest. 2012. PMID: 22484818 Free PMC article.
-
EBNA3C augments Pim-1 mediated phosphorylation and degradation of p21 to promote B-cell proliferation.PLoS Pathog. 2014 Aug 14;10(8):e1004304. doi: 10.1371/journal.ppat.1004304. eCollection 2014 Aug. PLoS Pathog. 2014. PMID: 25121590 Free PMC article.
-
MicroRNA-638 inhibits cell proliferation by targeting suppress PIM1 expression in human osteosarcoma.Tumour Biol. 2016 Dec;37:16367–16375. doi: 10.1007/s13277-016-5379-1. Epub 2017 Jan 3. Tumour Biol. 2016. PMID: 28050866
References
-
- Abdulkadir SA, Carvalhal GF, Kaleem Z, Kisiel W, Humphrey PA, Catalona WJ, et al. Tissue factor expression and angiogenesis in human prostate carcinoma. Hum Pathol. 2000;31:443–447. - PubMed
-
- Abdulkadir SA, Carbone JM, Naughton CK, Humphrey PA, Catalona WJ, Milbrandt J. Frequent and early loss of the EGR1 corepressor NAB2 in human prostate carcinoma. Hum Pathol. 2001;32:935–939. - PubMed
-
- Aho TL, Sandholm J, Peltola KJ, Mankonen HP, Lilly M, Koskinen PJ. Pim-1 kinase promotes inactivation of the pro-apoptotic Bad protein by phosphorylating it on the Ser112 gatekeeper site. FEBS Lett. 2004;571:43–49. - PubMed
-
- Berns A, Mikkers H, Krimpenfort P, Allen J, Scheijen B, Jonkers J. Identification and characterization of collaborating oncogenes in compound mutant mice. Cancer Res. 1999;59:1773s–1777s. - PubMed
-
- Burton GR, Nagarajan R, Peterson CA, McGehee RE., Jr. Microarray analysis of differentiation-specific gene expression during 3T3-L1 adipogenesis. Gene. 2004;329:167–185. - PubMed
Publication types
MeSH terms
Substances
Grants and funding
LinkOut - more resources
Full Text Sources
Medical
Miscellaneous
