

Erythropoietin receptor contributes to melanoma cell survival in vivo
- PMID: 21860424
- PMCID: PMC3441831
- DOI: 10.1038/onc.2011.366
Erythropoietin receptor contributes to melanoma cell survival in vivo
Abstract
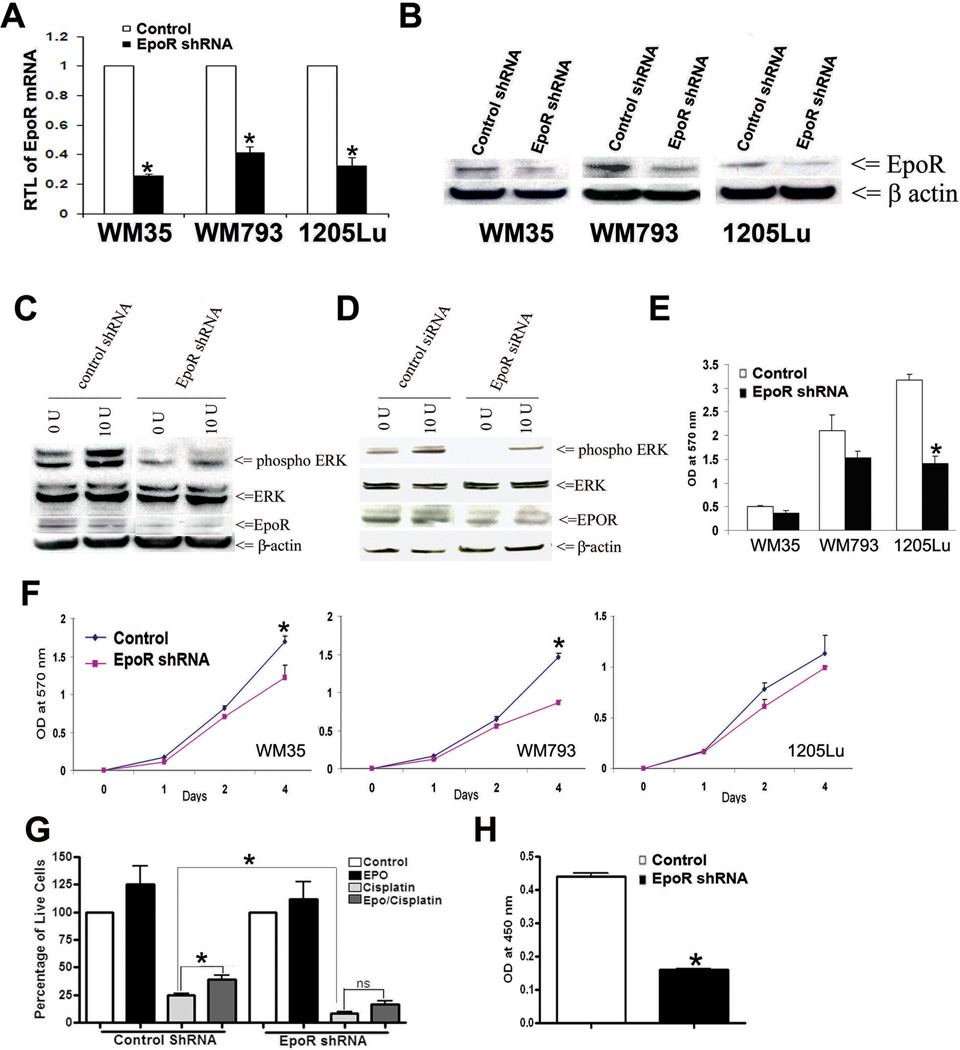
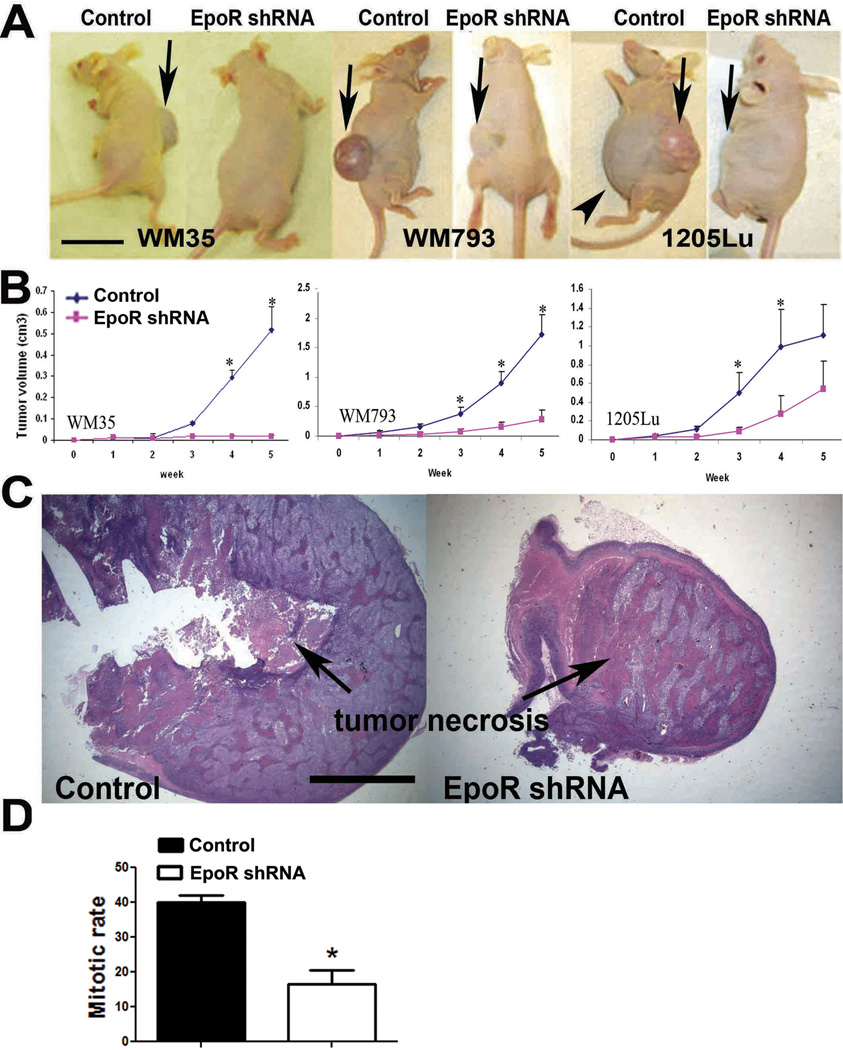
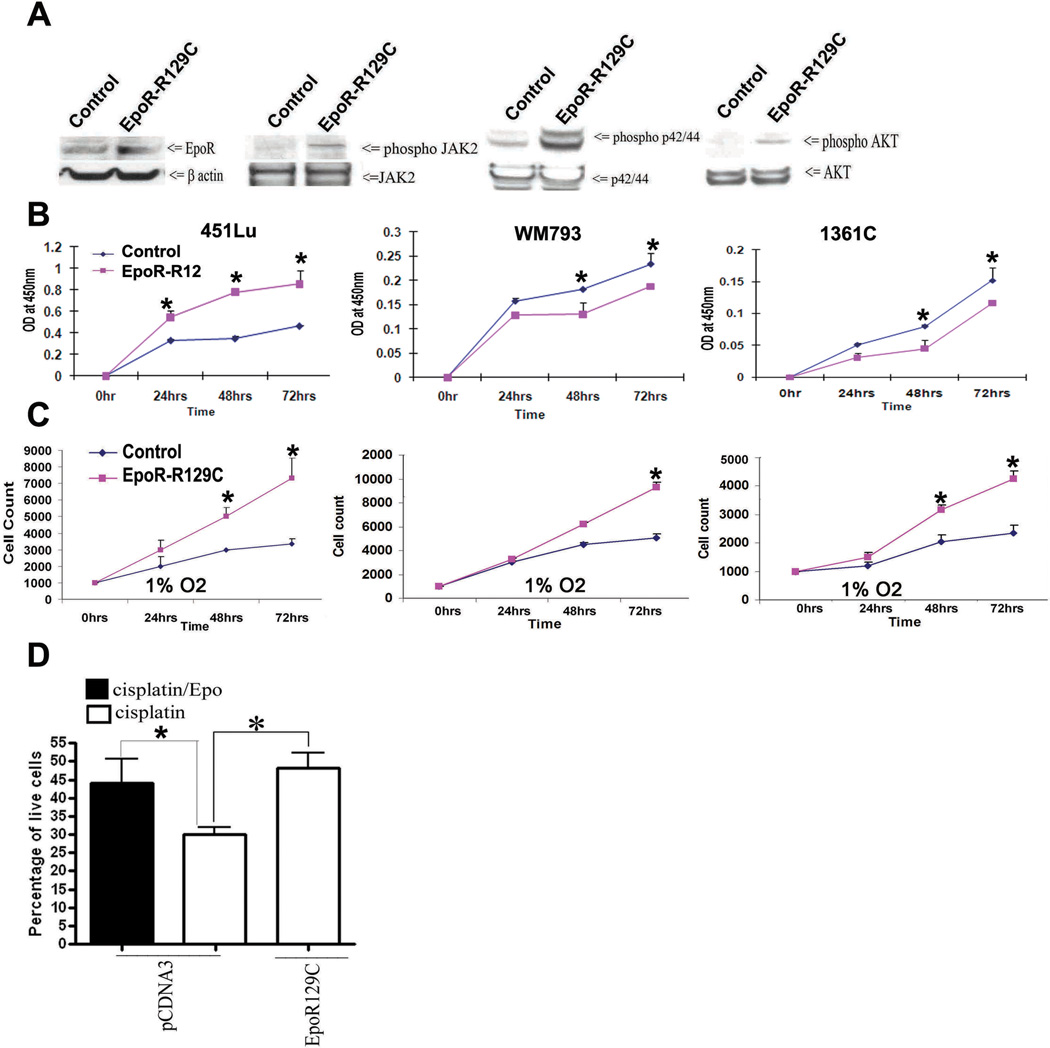
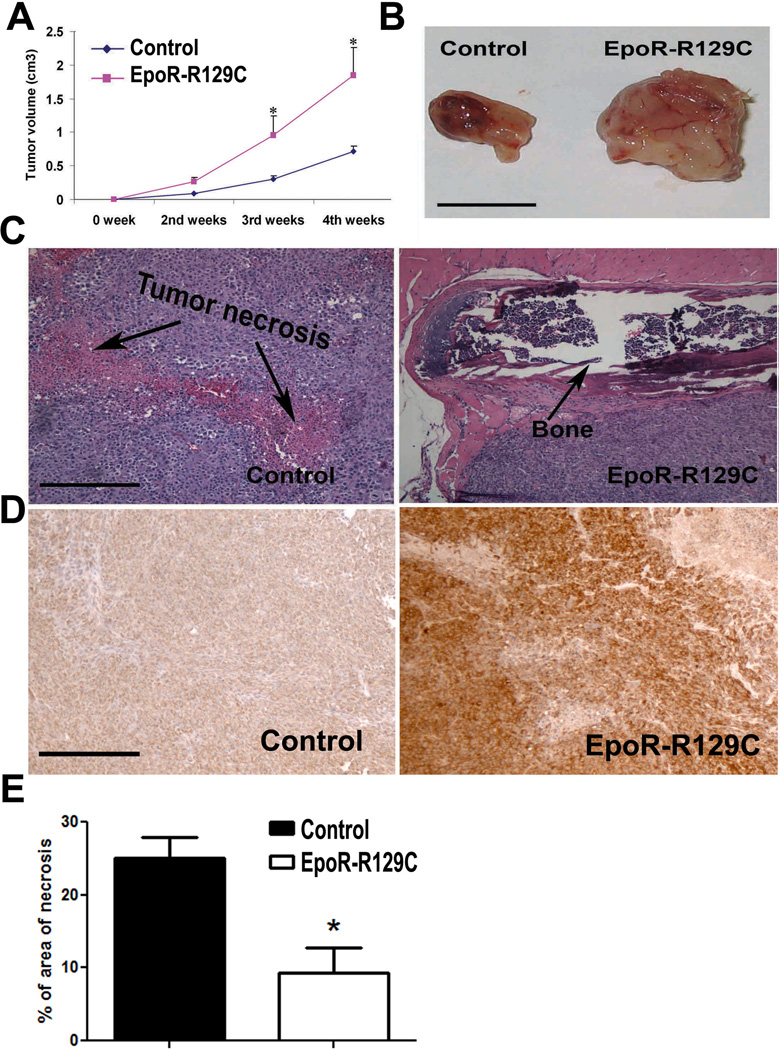
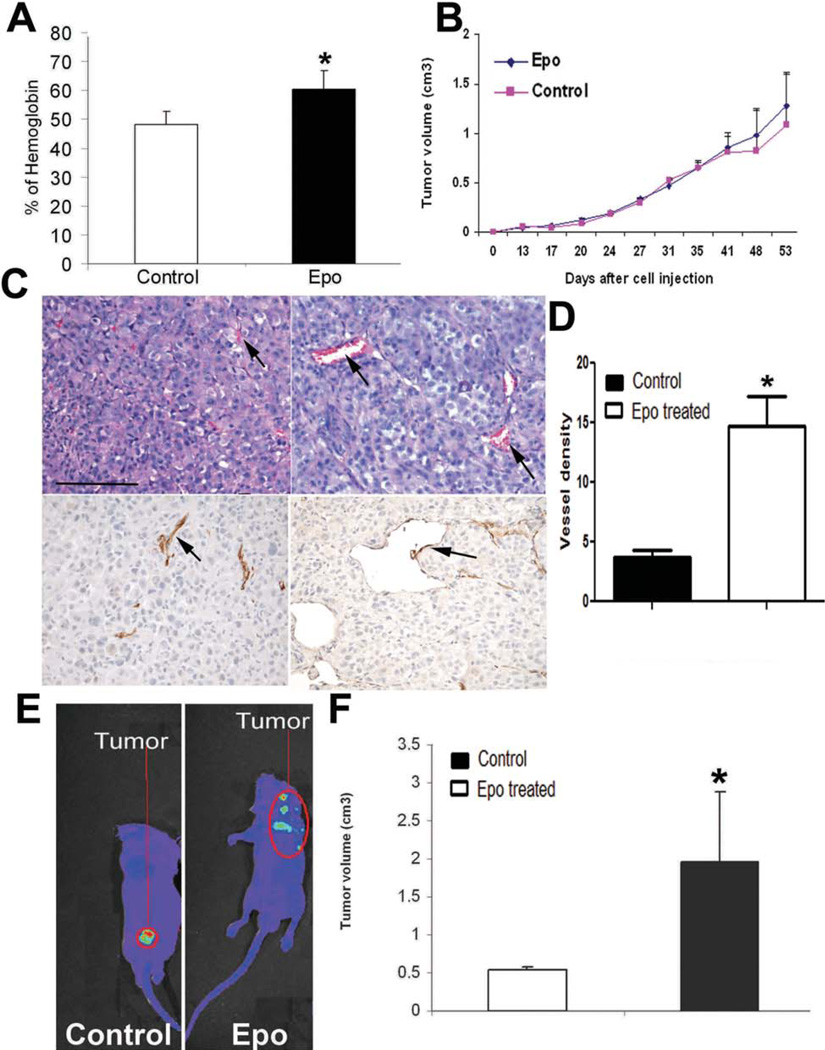
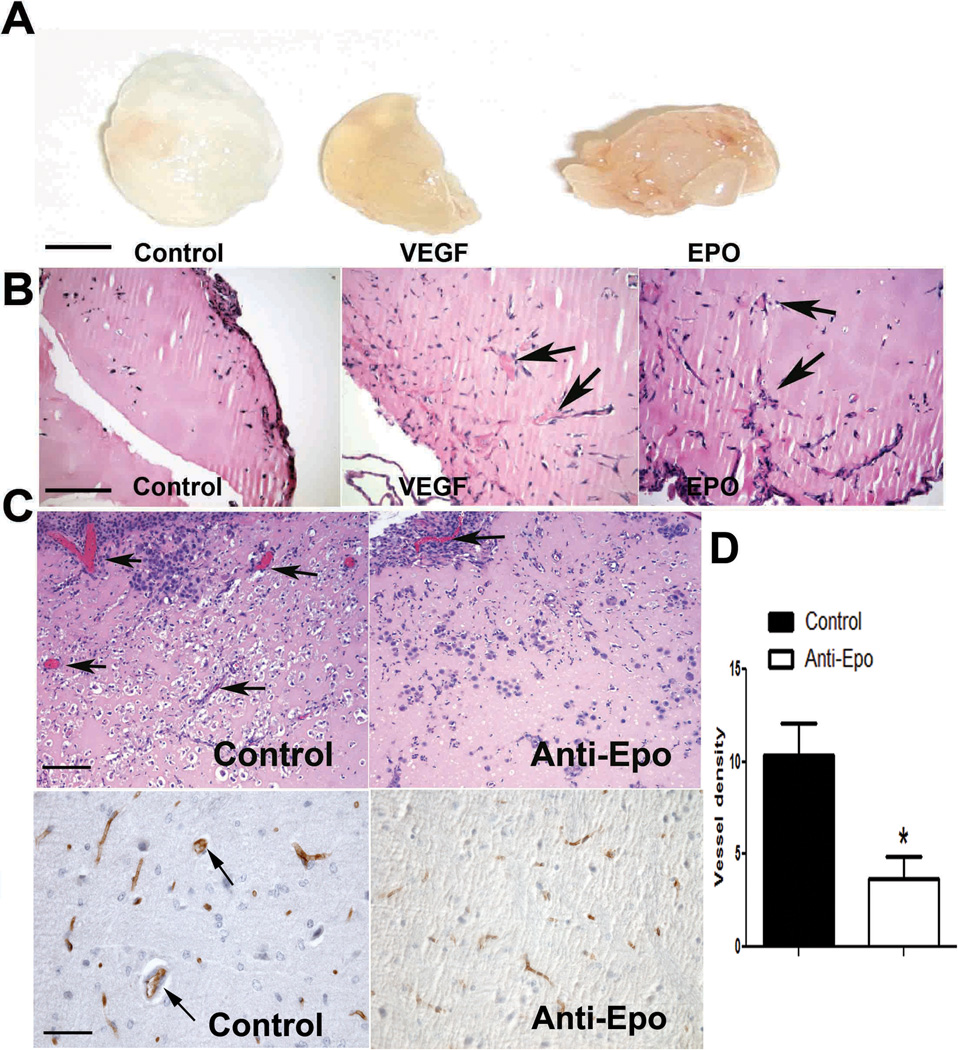
Erythropoietin (Epo) is widely used clinically to treat anemia associated with various clinical conditions including cancer. Data from several clinical trials suggest significant adverse effect of Epo treatment on cancer patient survival. However, controversy exists whether Epo receptor (EpoR) is functional in cancer cells. In this study, we demonstrated that EpoR mRNA expression was detectable in 90.1% of 65 melanoma cell lines, and increased copy number of the Epo and EpoR loci occurred in 30 and 24.6% of 130 primary melanomas, respectively. EpoR knockdown in melanoma cells resulted in diminished ERK phosphorylation in response to Epo stimulation, decreased cell proliferation and increased response to the inhibitory effect of hypoxia and cisplatin in vitro. EpoR knockdown significantly decreased melanoma xenograft size and tumor invasion in vivo. On the contrary, constitutive activation of EpoR activated cell proliferation pathways in melanoma cells and resulted in increased cell proliferation and resistance to hypoxia and cisplatin treatment in vitro. EpoR activation resulted in significantly larger xenografts with increased tumor invasion of surrounding tissue in vivo. Daily administration of recombinant Epo fails to stimulate melanoma growth in vivo, but the treatment increased vascular size in the xenografts. Increased local recurrence after excision of the primary tumors was observed after Epo treatment. Epo induced angiogenesis in Matrigel plug assays, and neutralization of Epo secreted by melanoma cells results in decreased angiogenesis. These data support that EpoR is functional in melanoma and EpoR activation may promote melanoma progression, and suggest that Epo may stimulate angiogenesis and increase survival of melanoma cells under hypoxic condition in vivo.
Conflict of interest statement
The authors declare no conflict of interest.
Figures
Similar articles
-
Recombinant human erythropoietin stimulates melanoma tumor growth through activation of initiation factor eIF4E.Oncotarget. 2017 May 2;8(18):30317-30327. doi: 10.18632/oncotarget.16331. Oncotarget. 2017. PMID: 28415825 Free PMC article.
-
EPO-independent functional EPO receptor in breast cancer enhances estrogen receptor activity and promotes cell proliferation.Biochem Biophys Res Commun. 2014 Feb 28;445(1):163-9. doi: 10.1016/j.bbrc.2014.01.165. Epub 2014 Feb 3. Biochem Biophys Res Commun. 2014. PMID: 24502950
-
The erythropoietin/erythropoietin receptor signaling pathway promotes growth and invasion abilities in human renal carcinoma cells.PLoS One. 2012;7(9):e45122. doi: 10.1371/journal.pone.0045122. Epub 2012 Sep 18. PLoS One. 2012. PMID: 23028796 Free PMC article.
-
Mystery Story about Erythropoietin (Epo) and Erythropoietin Receptor (EpoR) are Disguised?Hepatogastroenterology. 2015 May;62(139):585-9. Hepatogastroenterology. 2015. PMID: 26897933 Review.
-
Significance of Erythropoietin Receptor Antagonist EMP9 in Cancers.Vitam Horm. 2017;105:297-310. doi: 10.1016/bs.vh.2017.03.001. Epub 2017 Apr 18. Vitam Horm. 2017. PMID: 28629523 Review.
Cited by
-
Erythrocytosis in hepatocellular carcinoma portends poor prognosis by respiratory dysfunction secondary to mitochondrial DNA mutations.Hepatology. 2017 Jan;65(1):134-151. doi: 10.1002/hep.28889. Epub 2016 Nov 25. Hepatology. 2017. PMID: 27774607 Free PMC article.
-
Human rhabdomyosarcoma cells express functional erythropoietin receptor: Potential therapeutic implications.Int J Oncol. 2015 Nov;47(5):1989-97. doi: 10.3892/ijo.2015.3184. Epub 2015 Sep 24. Int J Oncol. 2015. PMID: 26412593 Free PMC article.
-
Effects of erythropoiesis-stimulating agents on fatigue- and anaemia-related symptoms in cancer patients: systematic review and meta-analyses of published and unpublished data.Br J Cancer. 2014 Jul 8;111(1):33-45. doi: 10.1038/bjc.2014.171. Epub 2014 Apr 17. Br J Cancer. 2014. PMID: 24743705 Free PMC article.
-
Erythropoietin improves the accumulation and therapeutic effects of carboplatin by enhancing tumor vascularization and perfusion.Theranostics. 2015 May 1;5(8):905-18. doi: 10.7150/thno.11304. eCollection 2015. Theranostics. 2015. PMID: 26000061 Free PMC article.
-
Macrophages M1-Related Prognostic Signature in Hepatocellular Carcinoma.J Oncol. 2021 Sep 23;2021:6347592. doi: 10.1155/2021/6347592. eCollection 2021. J Oncol. 2021. PMID: 34745260 Free PMC article.
References
-
- Acs G, Acs P, Beckwith SM, Pitts RL, Clements E, Wong K, Verma A. Cancer Res. 2001;61:3561–3565. - PubMed
-
- Acs G, Chen M, Xu X, Acs P, Verma A, Koch CJ. Cancer Lett. 2004a;214:243–251. - PubMed
-
- Acs G, Xu X, Chu C, Acs P, Verma A. Cancer. 2004b;100:2376–2386. - PubMed
-
- Arcasoy MO. Clin Cancer Res. 2008;14:4685–4690. - PubMed
-
- Arcasoy MO, Amin K, Chou SC, Haroon ZA, Varia M, Raleigh JA. Clin Cancer Res. 2005;11:20–27. - PubMed
Publication types
MeSH terms
Substances
Grants and funding
LinkOut - more resources
Full Text Sources
Medical
Research Materials
Miscellaneous
