. 2011 Aug 23;44(16):6594-6604.
doi: 10.1021/ma201277e.

Simulation of DNA Extension in Nanochannels

Affiliations

Simulation of DNA Extension in Nanochannels

Yanwei Wang et al. Macromolecules. .

Abstract

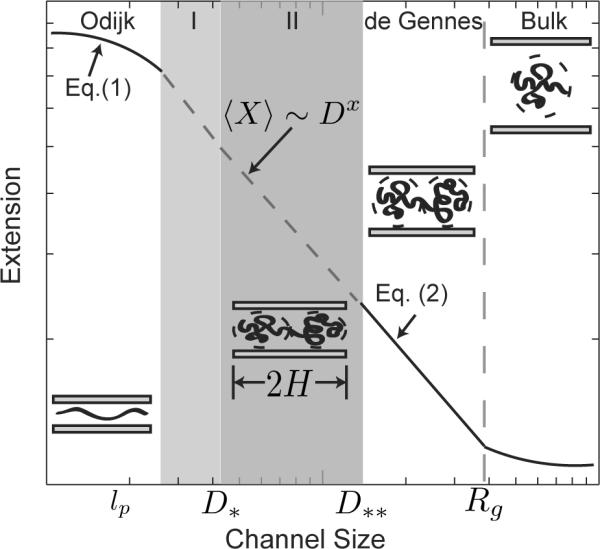
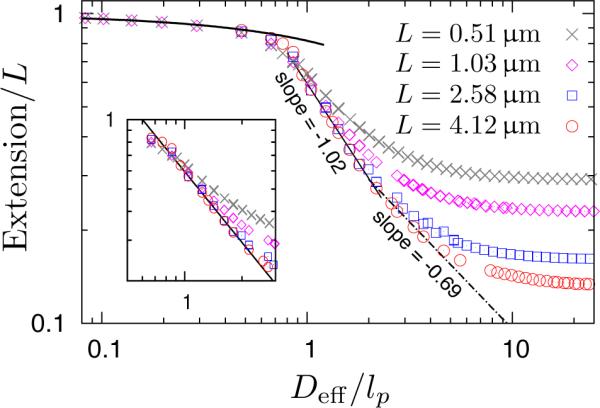
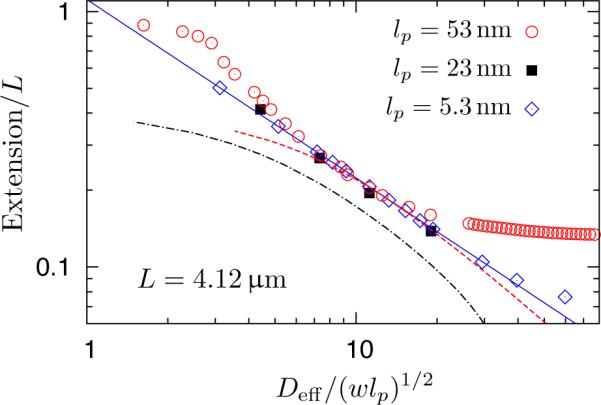
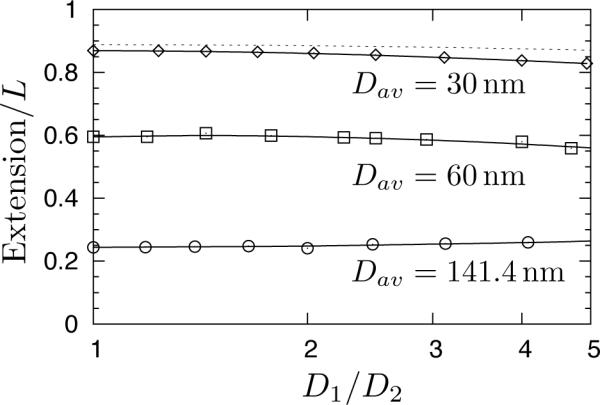
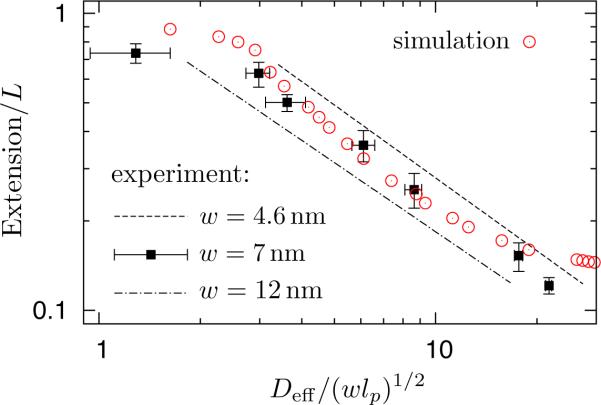
We have used a realistic model for double stranded DNA and Monte Carlo simulations to compute the extension (mean span) of a DNA molecule confined in a nanochannel over the full range of confinement in a high ionic strength buffer. The simulation data for square nanochannels resolve the apparent contradiction between prior simulation studies and the predictions from Flory theory, demonstrating the existence of two transition regimes between weak confinement (the de Gennes regime) and strong confinement (the Odijk regime). The simulation data for rectangular nanochannels support the use of the geometric mean for mapping data obtained in rectangular channels onto models developed for cylinders. The comparison of our results with experimental data illuminates the challenges in applying models for confined, neutral polymers to polyelectrolytes. Using a Flory-type approach, we also provide an improved scaling result for the relaxation time in the transition regime close to that found in experiments.


Figures

Figure 1
Figure 1
Schematic illustration of the different regimes of extension as a function of the channel size. The quantities D* and D** correspond to the transitions discussed in §2. The two shaded regions labeled I and II are the transition regimes described by Odijk; in what follows, region II will be referred to as the “extended de Gennes regime.” Various estimates for the exponent x are listed in Table 1. The schematics illustrate the DNA configuration under different degrees of confinement and the length scale H is discussed in §2.
Figure 2
Figure 2
Bulk properties of the wormlike bead-rod model (w = 4.6nm and lp = 53nm): simulations (open symbols) vs. theory (solid lines: wormlike chain theory in the absence of excluded volume for Re and Rg, dashed lines: excluded volume chain scaling with ν = 0.5877) and experimental results for Rg (solid symbols; diamond: Godfrey and Eisenberg, square: Robertson et al., triangle: Smith et al.).
Figure 3
Figure 3
Bulk mean span dimensions 〈X0 of the wormlike bead-rod model (w = 4.6nm and lp = 53nm). The left y-axis: fractional extension in free solution, 〈X0/L. The right y-axis: size ratio 〈X0/(2Rg).
Figure 4
Figure 4
Extension of the wormlike bead-rod model in square nanochannels; circle: with excluded volume interactions, x: without excluded volume interactions. Other parameters: w = 4.6nm, lp = 53nm, N = 800 beads. Dashed line: theoretical prediction of Odijk's regime Eq. (1) with no adjustable parameters. Deff/lp = 1 corresponds to a real channel dimension of D = 57.6nm.
Figure 5
Figure 5
Extension of the wormlike bead-rod model (w = 4.6nm, lp = 53nm) in square nanochannels. The plateau values at large Deff/lp for the shorter chains agree with the free space data in Figure 3. Deff/lp = 1 corresponds to a real channel dimension of D = 57.6nm. The inset shows the region near Deff/lp = 1 in more detail. Symbols: simulations. Thicker solid line: theoretical prediction of Odijk's regime [Eq. (1)] with no adjustable parameters. Thinner solid line: power-law fit to the data with an exponent of −1.02 ± 0.01 for channel widths ranging from 60nm to 120nm. Dash-dotted line: power-law fit to the data with an exponent of −0.69 ± 0.03 for channel widths ranging from 120nm to 200nm.
Figure 6
Figure 6
Extension of the wormlike bead-rod model (w = 4.6nm, L = 4.12μm) in square nanochannels. Circles: lp = 53nm. Squares: lp = 23nm. Diamonds: lp = 5.3nm. Solid line: a best power law fit to the simulation data of lp = 5.3nm, excluding the data points for the two widest channels (fitting function: y = axb with a = 1.113±0.002 and b = −0.698±0.001). Predictions the theory proposed Zhang et al. are shown for lp = 53nm (dashed line) and lp = 23nm (dash dotted line), respectively, using a common numerical constant C = 1.52 obtained by fitting their model to our simulation data for lp = 53nm; the numerical calculation of the extension with their model fails for lp = 5.3nm and w = 4.6nm because the theory is only valid for slender segments. Deff/(wlp)1/2 = 10 corresponds to a real channel dimension of D = 160.7nm for lp = 53nm, D = 107.4nm for lp = 23nm and D = 54.0nm for lp = 5.3nm.
Figure 7
Figure 7
Extension of the wormlike bead-rod model (w = 4.6nm, lp = 53nm) in nanochannels of D1-by-D2 rectangular cross section. The geometric average of the channel size is Dav = (D1D2)1/2. Symbols are simulation data for three different contour lengths: L = 1.03μm for Dav = 30nm (diamond), L = 2.58μm for Dav = 60nm (square), and L = 4.12μm for Dav = 141.4nm (circle). Solid lines are smooth Bezier curves to approximate the data trend. The dashed line refers to predictions for the Odijk regime, where we used Dav = 30nm, w = 4.6nm, and lp = 53nm.
Figure 8
Figure 8
Comparison of simulation (circle) and experimental data. The simulation data correspond to L = 4.12μm, w = 4.6nm and lp = 53nm in a square nanochannel, the same as that shown in Figure 6. The experimental data as a function of Deff = Davw were plotted using a persistence length lp = 57.5nm reported by Reisner et al. and different values for the effective width: w = 4.6nm (dashed line), w = 7.0nm (squared symbols) and w = 12nm (dash dotted line). For clarity, we only show the best power-law fits to the data for channel sizes ranging from 440nm to 60nm for w = 4.6nm and 12nm, a similar analysis to Reisner et al.Deff/(wlp)1/2 = 10 corresponds to a real channel dimension of D = 160.7nm for w = 4.6nm and lp = 53nm and corresponds to D = 207.6nm for w = 7.0nm and lp = 57.5nm.

References

    1. Tegenfeldt JO, Prinz C, Cao H, Chou S, Reisner WW, Riehn R, Wang YM, Cox EC, Sturm JC, Silberzan P, Austin RH. Proc. Natl. Acad. Sci. USA. 2004;101:10979–10983. - PMC - PubMed
    1. Jo K, Dhingra DM, Odijk T, de Pablo JJ, Graham MD, Runnheim R, Forrest D, Schwartz DC. Proc. Natl. Acad. Sci. USA. 2007;104:2673–2678. - PMC - PubMed
    1. Kim Y, Kim KS, Kounovsky KL, Chang R, Jung GY, dePablo JJ, Jo K, Schwartz DC. Lab Chip. 2011;11:1721–1729. - PMC - PubMed
    1. Chan EY, Goncalves NM, Haeusler RA, Hatch AJ, Larson JW, Maletta AM, Yantz GR, Carstea ED, Fuchs M, Wong GG, Gullans SR, Gilmanshin R. Genome Res. 2004;14:1137–1146. - PMC - PubMed
    1. Riehn R, Lu M, Wang Y-M, Lim SF, Cox EC, Austin RH. Proc. Natl. Acad. Sci. USA. 2005;102:10012–10016. - PMC - PubMed

LinkOut - more resources