

Unchanged muscle fiber conduction velocity relates to mild acidosis during exhaustive bicycling
- PMID: 21861110
- PMCID: PMC3324688
- DOI: 10.1007/s00421-011-2119-5
Unchanged muscle fiber conduction velocity relates to mild acidosis during exhaustive bicycling
Abstract
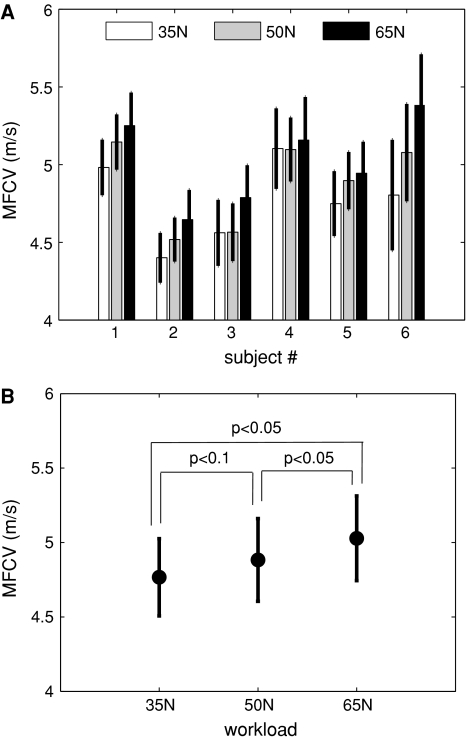
Muscle fiber conduction velocity (MFCV) has often been shown to decrease during standardized fatiguing isometric contractions. However, several studies have indicated that the MFCV may remain constant during fatiguing dynamic exercise. It was investigated if these observations can be related to the absence of a large decrease in pH and if MFCV can be considered as a good indicator of acidosis, also during dynamic bicycle exercise. High-density surface electromyography (HDsEMG) was combined with read-outs of muscle energetics recorded by in vivo (31)P magnetic resonance spectroscopy (MRS). Measurements were performed during serial exhausting bouts of bicycle exercise at three different workloads. The HDsEMG recordings revealed a small and incoherent variation of MFCV during all high-intensity exercise bouts. (31)P MRS spectra revealed a moderate decrease in pH at the end of exercise (~0.3 units down to 6.8) and a rapid ancillary drop to pH 6.5 during recovery 30 s post-exercise. This additional degree of acidification caused a significant decrease in MFCV during cycling immediately after the rest period. From the data a significant correlation between MFCV and [H(+)] ([H(+)] = 10(-pH)) was calculated (p < 0.001, Pearson's R = -0.87). Our results confirmed the previous observations of MFCV remaining constant during fatiguing dynamic exercise. A constant MFCV is in line with a low degree of acidification, considering the presence of a correlation between pH and MFCV after further increasing acidification.
Figures


Similar articles
-
Supernormal muscle fiber conduction velocity during intermittent isometric exercise in human muscle.J Appl Physiol (1985). 1994 Aug;77(2):802-6. doi: 10.1152/jappl.1994.77.2.802. J Appl Physiol (1985). 1994. PMID: 8002531 Clinical Trial.
-
Muscle fiber conduction velocity during isometric contraction and the recovery period.Electromyogr Clin Neurophysiol. 2000 Apr-May;40(3):151-61. Electromyogr Clin Neurophysiol. 2000. PMID: 10812538
-
Reproducibility of muscle fibre conduction velocity during linearly increasing force contractions.J Electromyogr Kinesiol. 2020 Aug;53:102439. doi: 10.1016/j.jelekin.2020.102439. Epub 2020 Jun 10. J Electromyogr Kinesiol. 2020. PMID: 32563844
-
Influence of contraction force and speed on muscle fiber conduction velocity during dynamic voluntary exercise.J Electromyogr Kinesiol. 2001 Apr;11(2):85-94. doi: 10.1016/s1050-6411(00)00048-1. J Electromyogr Kinesiol. 2001. PMID: 11228422
-
Effects of older age on contraction-induced intramyocellular acidosis and inorganic phosphate accumulation in vivo: A systematic review and meta-analysis.PLoS One. 2024 Sep 25;19(9):e0308336. doi: 10.1371/journal.pone.0308336. eCollection 2024. PLoS One. 2024. PMID: 39321147 Free PMC article.
Cited by
-
Corticospinal responses to sustained locomotor exercises: moving beyond single-joint studies of central fatigue.Sports Med. 2013 Jun;43(6):437-49. doi: 10.1007/s40279-013-0020-6. Sports Med. 2013. PMID: 23456490 Review.
-
Wet, volatile, and dry biomarkers of exercise-induced muscle fatigue.BMC Musculoskelet Disord. 2016 Jan 21;17:40. doi: 10.1186/s12891-016-0869-2. BMC Musculoskelet Disord. 2016. PMID: 26790722 Free PMC article.
-
Improving the physiological realism of experimental models.Interface Focus. 2016 Apr 6;6(2):20150076. doi: 10.1098/rsfs.2015.0076. Interface Focus. 2016. PMID: 27051507 Free PMC article. Review.
-
Are the antagonist muscle fatigued during a prolonged isometric fatiguing elbow flexion at very low forces for young adults?Front Physiol. 2022 Oct 7;13:956639. doi: 10.3389/fphys.2022.956639. eCollection 2022. Front Physiol. 2022. PMID: 36277214 Free PMC article.
-
Conduction Velocity of Muscle Action Potential of Knee Extensor Muscle During Evoked and Voluntary Contractions After Exhaustive Leg Pedaling Exercise.Front Physiol. 2020 May 27;11:546. doi: 10.3389/fphys.2020.00546. eCollection 2020. Front Physiol. 2020. PMID: 32536878 Free PMC article.
References
-
- Blok JH, Van Dijk JP, Drost G, Zwarts MJ, Stegeman DF. A high-density multichannel surface electromyography system for the characterization of single motor units. Rev Sci Instrum. 2002;73:1887–1897. doi: 10.1063/1.1455134. - DOI
MeSH terms
LinkOut - more resources
Full Text Sources
Medical
